Transforming Vegetation Management with Remote Sensing: at Kentucky Power
Key Highlights
- Kentucky Power shifted from reactive storm response to predictive vegetation management using helicopter LiDAR and imagery.
- The program focused on high-risk circuits, enabling targeted ROW widening and outage reduction efforts.
- Span-level risk observations revealed nearly 95% of analyzed spans had vegetation exposure, guiding precise interventions.
- Slope and tree position analysis improved clearance strategies, reducing fall-in and grow-in risks without expanding ROW footprint.
- Operational integration of remote sensing data enhanced crew efficiency, prioritizing high-risk areas and improving reliability outcomes.
Vegetation remains the single largest contributor to electric distribution outages in North America. Historically, utilities have relied on cyclical trimming, field patrols and reactive storm response to manage a challenge that is inherently spatial, dynamic and risk-driven. Today, that paradigm is shifting.
In response to persistent vegetation-related reliability challenges in steep, heavily forested terrain, Kentucky Power implemented a targeted remote-sensing program to shift vegetation management from a routine maintenance activity to a predictive reliability discipline. By combining helicopter LiDAR, high-resolution ortho and oblique imagery and outage-driven risk analysis, the utility established a defensible, data-backed framework for prioritizing vegetation risk and supporting a long-term right-of-way (ROW) strategy.
The Business Case: Reliability, Transparency and Financial Discipline
For utility executives and regulators, the question is no longer whether remote sensing works — it is whether it can be scaled responsibly, integrated operationally and defended financially.
At Kentucky Power in Ashland, Kentucky, U.S., outage history and circuit performance metrics were used to identify three high-risk distribution circuits totaling about 320 miles. These corridors were selected to support a ROW-widening program and to establish a measurable baseline for long-term planning.
Rather than pursuing broad, system-wide data collection, the program focused on acquisition where vegetation-related outages posed the greatest threat to customers and system performance. The result was a clear alignment between spend and reliability outcomes, supported by measurable data that could be communicated effectively to internal stakeholders and regulators.
This approach reframed cost per mile as cost per avoided outage. More specifically, by approaching this as a long-term commitment, Kentucky Power can measure outage reductions over time and compare the cost of reliability improvements under this program with those of other reliability programs.
A Distribution First Approach — Not a Transmission Retrofit
While LiDAR has been used on transmission systems for years, Kentucky Power’s program was intentionally designed as a distribution-focused initiative rather than a scaled-down transmission inspection.
Transmission LiDAR programs typically prioritize conductor clearance, structure geometry and corridor compliance over long distances with relatively consistent right-of-way conditions. Distribution systems experience all the variability of transmission systems but also the additional variation of mixed land ownership, tight ROWs, rural-to-urban transitions, and dense roadside vegetation with significant vegetation overhanging the conductors.
This program was built specifically to address those realities.
Rather than focusing on tower-to-tower geometry, the analytics emphasized:
- Span level vegetation exposure on single and multi-phase distribution circuits
- Grow-in dynamics driven by lateral canopy expansion typical of roadside and edge-of-ROW vegetation
- Fall-in and strike-tree potential influenced by slope, tree height and proximity
Rather than prioritize structure geometry or conductor clearance alone, the program focused on how vegetation interacts with distribution infrastructure under real-world conditions.
Just as important, this effort was executed at a distribution‑appropriate scale and cost. Price‑per‑mile targets, point density, swath width and analytics depth were selected to balance accuracy with operational practicality – making the programs repeatable year over year, not a one‑time capital exercise.
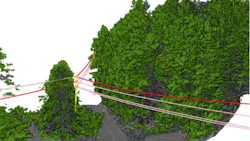
Data acquisition and analysis were performed under the One Asplundh initiative, leveraging Rotor Blade, typically used for aerial saw trimming, and the Digital Innovation teams from ArborMetrics and Asplundh. For data collection, the aerial saw equipment was removed from the helicopter and replaced with a LiDAR sensor and high-resolution camera system. This approach enabled efficient data collection using experienced utility aviation crews.
For utilities evaluating LiDAR beyond transmission, this project demonstrates that distribution remote sensing is not a simplified version of transmission LiDAR. It is a distinct discipline — one that requires different assumptions, different metrics and tighter integration with vegetation management operations.
Insight at the Span Level
From a system planning and vegetation management perspective, the level of detail now achievable fundamentally changes how risk is understood.
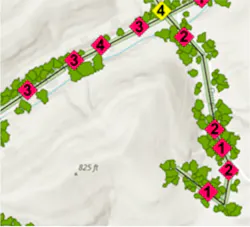
Using helicopter-based LiDAR and high-resolution imagery, more than 125,000 vegetation risk observations were identified on the Kentucky Power footprint, with nearly 95% of analyzed spans exhibiting some form of grow-in or fall-in exposure. This highlights that a concentrated risk can exist even on a limited number of circuits.
Grow-in measurements were calibrated to reflect regional growth rates, accounting for lateral canopy expansion of up to 6 ft annually, and this factor was directly incorporated into encroachment classification. Fall-in and strike-tree exposure were assessed within a 250-ft swath, incorporating both tree height and slope to identify overstrike potential.
ROW widths were shifted to either side of the centerline based on corridor slope. Shifting the ROW clearance emphasis upslope reduces both grow-in and fall-in exposure even though the total ROW width stays the same.
The importance of slope and tree position relative to the line, i.e. upslope vs downslope, is frequently overlooked by utility vegetation managers. Trees that are upslope are prone to fall toward the line, require less height to strike the conductor and are more likely to overstrike the line during storms or saturated soil conditions. Steep terrain often correlates with deeper soils and higher moisture retention on the upslope side. This tends towards faster lateral canopy expansion and repeated regrowth pressure.
Shifting the ROW toward the steeper side of the corridor aligns clearance with true vegetation exposure. By increasing separation where gravity, slope, and tree height combine to elevate risk, utilities can reduce fall-in and grow-in threats more effectively — without expanding the corridor's overall footprint. The only scalable way to quantify the risk posed by trees growing on a slope is remote sensing.
This span-level intelligence enabled:
- Span level risk modeling
- Circuit-level prioritization tied to SAIDI (System Average Interruption Duration Index) and customer sensitivity
- Scenario testing for budget, schedule and treatment strategy
- A defensible baseline for evaluating progress over time
Remote sensing does not replace the judgment of vegetation managers and foresters — it amplifies it with measurable, repeatable insight.
Using Data to Support a ROW Widening Strategy
LiDAR and remote sensing programs have typically supported traditional cyclic vegetation management models.
When a utility’s distribution system already operates under a well-established trim cycle with defined treatment prescriptions and reliability targets, remote sensing is used to:
- Identify trees of interest contributing to repeat outages
- Improve prioritization within and across cycles
- Shift work earlier in the cycle where risk and customer impact are highest
Rather than redefining corridor widths or treatment standards, programs focus on precision and timing — ensuring the right vegetation is treated at the right point in the cycle. This allows the utility to preserve the structure of its existing program while materially improving reliability outcomes.
For utilities with mature cyclic programs, this approach demonstrates how LiDAR can serve as a force multiplier, enhancing the effectiveness of established practices without disrupting operations.
Steep terrain, fast-growing species, and narrow historical corridors created conditions in which traditional trimming alone was insufficient. Remote sensing analytics were used to:
- Quantify existing ROW widths by span
- Model future grow-in risk based on lateral canopy expansion-in risk based on lateral canopy expansion
- Identify where widening would provide the greatest long-term reliability benefit
- Support new clearance targets
By grounding widening decisions in measured data rather than estimates, Kentucky established a defensible, repeatable framework for expanding corridors where it mattered most — without applying a one-size-fits-all solution system-wide.
For utilities facing similar geographic or growth challenges, Kentucky’s program illustrates how LiDAR can enable strategic change, not just incremental improvement.
Operational Impact: Turning Analytics into Action
The most significant shift occurred at the operational level.
Remote sensing outputs were delivered in formats designed for planning and field use, including interactive web maps and prioritized span-level analytics. Supervisors and field leaders gained unprecedented visibility into how vegetation risk was distributed along their circuits.
As a result, crews arrived with context rather than just coordinates. High-risk spans were addressed first, not deferred to future cycles. Field time was spent mitigating risk and not searching for it.
The outcome was not just efficiency — it was confidence that effort was aligned with consequence.
Remote sensing programs succeed when vegetation managers operationalize the intelligence they provide — using data-driven insights to inform decisions, prioritize work and act decisively on identified risk.
Lessons Learned: Scaling Requires Discipline
Kentucky Power’s experience reinforced a critical point: successful remote sensing initiatives require the same discipline as any major utility program.
Key lessons included:
- Validate circuit geometry and GIS alignment before acquisition
- Build schedule margin into flight planning
- Standardize vegetation distance rules and analytics definitions
- Align specifications across geospatial, forestry and operations teams
Most importantly, success depended on treating remote sensing as a program, not a one-time project.
The Path Forward: Continuous Vegetation Intelligence
Kentucky Power concluded with a clear recommendation: continue and expand remote sensing on an annual or cyclic basis.
The long-term vision includes:
- Continuous monitoring instead of episodic assessment
- Predictive vegetation resilience instead of reactive trimming
- Analytics embedded directly into work planning and long-term strategy
For utilities facing increasing storm intensity, regulatory scrutiny and workforce constraints, remote sensing is no longer an innovation experiment. It is becoming a core operational capability — one that enables reliability to be predicted rather than repaired.
About the Author
Cassie Bond
Cassie Bond, GISP, is the Geospatial Manager for Asplundh Tree Expert, LLC where she leads GIS and remote sensing initiatives supporting electric utility vegetation management programs across North America. She oversees LiDAR analytics, vegetation risk modeling and ArcGIS Enterprise implementations used by vegetation managers, foresters and field operations teams. She holds an MS degree in Forest Resources from Clemson University. She regularly presents at industry events including the Esri User Conference, Esri IMGIS and Trees & Utilities. She can be reached at [email protected]