Enhancing Wildfire Response: PNM's Advanced GIS Dashboard for PSPS
Key Highlights
- PNM’s GIS dashboard suite improves wildfire mitigation by providing real-time alerts, outage visualization, and risk assessments across the state.
- The platform enables cross-departmental coordination, reducing redundant field deployments by up to 20% and improving outage response times.
- Automated identification of medically vulnerable customers ensures they are prioritized during PSPS events, enhancing safety and trust.
- Dynamic restoration modeling helps optimize crew deployment, reducing feeder restoration times by up to 30%.
- Future enhancements include real-time data feeds, push notifications, and AI-driven predictive analytics to further strengthen emergency response capabilities.
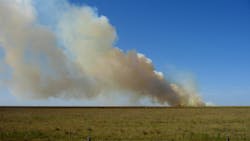
Extreme weather events fueled by global climate change have impacted the power delivery system in many ways no one could have anticipated. As a result, Public Service Co. of New Mexico (PNM) has had to take drastic methods to protect both the utility’s infrastructure and its customers. These severe storms can bring flooding, produce hurricane-force winds and trigger dangerous temperatures. Climate change also creates droughts with highly combustible vegetation subject to wildfires and many other dangerous conditions. There is no choice, PNM must be ready to respond quickly at a moment’s notice.
Many utilities and grid operators have developed an emergency procedure known as the public safety power shutoff (PSPS) process as has PNM. Determining whether to shut off power during an emergency is an important decision. Emergency response requires dynamic balance when shutting off power circuits early enough to prevent wildfires. However, it also must be tempered with the need to maintain critical infrastructure for as long as possible for those in need.
In keeping with this concept, PNM has implemented an advanced situational awareness platform to enhance decision-making and fast response during PSPS events. This platform is a geographic information system (GIS) based dashboard suite that uses enhanced machine learning to analyze complex datasets. It also enables real-time visibility into customer impact, critical infrastructure, restoration progress and weather risk across the grid. The sophisticated suite of tools — including a high fire risk area (HFRA) alert dashboard, PSPS dashboard and real-time isolation dashboard — supports regulatory compliance, customer safety and operational efficiency, positioning PNM as a forward-thinking utility addressing wildfire threats through proactive planning and technology-driven strategies.
Value and Readiness
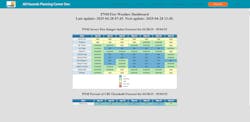
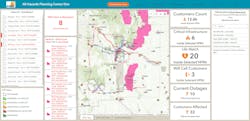
The HFRA alert dashboard demonstrates how red flag warnings, current outages and critical infrastructure exposure are integrated across the state. This intelligent tool supports decision-making in pre-deenergization phases and mitigates risks while encouraging collaboration throughout the organization.
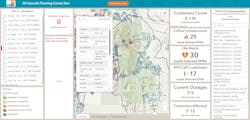
The PSPS dashboard is not simply a tool for outage visualization; it is a strategic platform for cross-departmental coordination. By centralizing real-time data, departments such as T&D operations, customer service, emergency planning and regulatory affairs can work from a single source of truth.
During active PSPS scenarios, the dashboard serves as a real-time status board, informing executive decisions on grid sectionalizing, restoration prioritization and communication protocols. This real-time status improves transparency and speed of response, which are critical in fast-evolving wildfire conditions. In practice, the dashboard has helped to reduce redundant field deployment by up to 20%, while improving coordination with crisis communications teams and reducing call center escalations. The result is a more agile and informed organization capable of responding dynamically under stress.
Capturing and reporting historical metrics from PSPS events not only supports compliance reporting and future rate case justifications, but also plays an increasingly vital role in regulatory strategy by helping to eliminate silos of influence — ultimately enabling ongoing innovation. Geospatial dashboards convert complex emergency data into intuitive visuals that support informed, high-speed decision-making. When PSPS decisions must be made within minutes, clarity and access to key indicators like customer counts, critical facilities and feeder conditions can make all the difference. The platform reinforces PNM’s role as a responsible steward of public safety. By demonstrating a proactive, technologically advanced approach to wildfire mitigation, the utility can enhance its standing with regulators, communities and stakeholders.
In addition, customer service teams use the dashboard to identify and prioritize communication with Life Watch and Will Call customers. This proactive outreach helps to maintain trust and reduce inbound call volume during emergency events. The dashboard also can be used for training and planning because it has the ability to simulate event outcomes. By using it to rehearse PSPS scenarios, the dashboard strengthens PNM’s overall emergency readiness posture. Collectively, these capabilities reduce unnecessary field dispatches, improve outage response times and ensure a coordinated restoration process grounded in data, not guesswork.
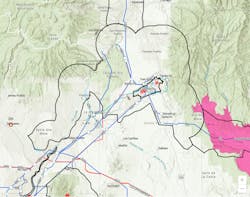
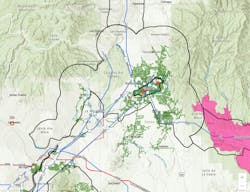
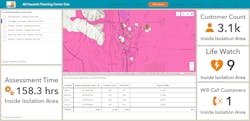
The real-time isolation dashboard gives a visualization of the impacted feeders, customer counts, and estimated restoration hours. This enables personnel in the field and on the system coordination during PSPS scenarios.
Strategic Importance
PSPS events are a critical tool in wildfire mitigation, but they present complex operational, regulatory and reputational challenges. PNM’s geospatial dashboard approach transforms these challenges into manageable operations by aligning asset data, risk modeling and customer prioritization in a single operational view. This system supports the utility’s mission to deliver safe, reliable energy and to exceed regulatory and customer expectations in HRFAs.
The PSPS dashboard system provides users with interactive tools that enhance planning, situational analysis and event forecasting. Users can drill down into feeder segments, view historical outage data and overlay risk models to support PSPS preparedness.
Life Watch customers are identified automatically and visually flagged, allowing for preemptive engagement by customer service and field teams. This ensures medically dependent customers are never overlooked during isolation events.
Visual Intelligence
The PSPS dashboards enable stakeholders — from control room operators to emergency response coordinators — to gain situational awareness instantly. By visualizing feeder-level impacts, critical customer locations and restoration estimates, decision-makers can act with clarity and speed. Key benefits are as follows:
- Real-time identification of medically vulnerable customers.
- Dynamic restoration time estimates by feeder.
- Centralized outage and alert visualization during red flag conditions.
- Deenergization exception plans visualized and linked to documented procedures to ensure power is not lost to critical sites during PSPS.
Dynamic restoration modeling is a key differentiator. System operators can evaluate various restoration scenarios based on current crew availability, asset condition and projected weather impacts. This helps to minimize downtime without compromising safety. Moreover, the dashboards foster collaboration by offering a common operating picture across departments. Whether accessed in the control room or the emergency operations center, everyone sees the same accurate, real-time data.
This transformation from manual mapping and spreadsheets to automated intelligence has significantly reduced decision-making delays, shortened outage windows and improved stakeholder engagement.
Restoration Activities
Through the integration of outage tracking, crew modeling and customer outreach tools, PNM can coordinate restoration activities immediately after deenergization. This reduces downtime for essential customers and ensures compliance with regulatory restoration timelines. Field crews are dispatched with route intelligence, and Will Call customers are tracked and contacted efficiently.
Beyond operational value, the platform ensures PNM remains aligned with state mandates and emergency protocols, demonstrating a best-practice approach to utility wildfire mitigation.
This GIS dashboard strategy ensures enterprise alignment across T&D, customer service, emergency planning and regulatory affairs. It streamlines interdepartmental coordination, enhances reporting readiness and fulfills mandates for community protection and grid reliability during fire season. With this platform, PNM elevates PSPS from reactive disruption to managed, transparent operations.
With the dashboard’s integrated crew modeling features, PNM can forecast estimated time to restoration for each affected feeder. This information enables planners to better allocate field resources and optimize logistics for restoration efforts.
Measurable Value
PNM’s PSPS dashboard suite delivers measurable value in risk reduction, operational efficiency and customer safety. It demonstrates the role of geospatial technology as a force multiplier for utility preparedness and resilience. By integrating real-time asset data and operational intelligence, field and system teams can coordinate responses in minutes instead of hours. By leveraging restoration modeling and route optimization, PNM expects to reduce feeder restoration times by up to 30%, saving more than 150 labor hours during recent event simulations. Automated Life Watch identification further cuts manual lookup times by an estimated 2 hours to 3 hours per event, easing the burden on call centers and enabling faster, more efficient customer outreach. As the wildfire landscape continues to evolve, this strategic approach ensures PNM leads with foresight, precision and a commitment to keeping communities safe and powered.
Looking ahead, the second phase of this initiative will expand the dashboard’s functionality through the integration of GeoEvent Server, enabling real-time data feeds and automated alerts. Push notification capabilities will also be introduced to deliver recloser instructions directly to field personnel during PSPS events. Furthermore, advanced AI integration is planned to enhance predictive modeling and operational foresight.
About the Author
Gathen Garcia
Gathen Garcia directs the drafting and geographic information systems (DGIS) group for Public Service Company of New Mexico. The DGIS group was established to develop, manage and communicate an array of geographic data and visual information important to the success of PNM Resources as a leading energy provider. Under Garcia’s leadership, DGIS is structured into three broad groups: computer-aided design (CAD), GIS and information visualization (InfoVis). The small but versatile CAD and GIS staff complement each other to provide unique and powerful data management, presentation tools, design tools and services to a broad range of clients ranging from the technical to the nontechnical, from engineers to the executive suite.
Larry “Chris” Carpenter
Larry “Chris” Carpenter is the GIS supervisor at PNM, with over 23 years of experience in geospatial systems, enterprise data integration, and utility infrastructure mapping. He leads the development of spatial platforms that improve emergency response, system reliability and cross-departmental coordination.
