Using AI Software to Mitigate Extreme Weather Threats
Research shows 90% of energy executives rank extreme weather as a financial threat to their grid business? They’re right to worry: the U.S. Energy Information Administration reported that the average American household spent eight hours without power last year, with extreme weather events causing more frequent and severe outages.
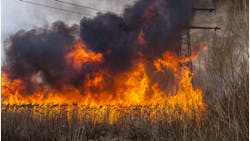
In 2021, wildfires damaged power lines across North America, particularly on the West Coast, and response has often involved cutting electricity to areas at risk of floods or fires, leaving millions without power to avoid the risk of a flow of electricity exacerbating hazards.
Extreme weather is increasing the risks from vegetation encroaching on power lines, from vegetation catching fire, to storms knocking trees onto power lines. Even worse, the interaction between power networks and extreme weather events has seen utilities inadvertently cause wildfires, typically when storms blow sparks over dry vegetation.
At the same time, the growing decentralization of energy generation as we move to renewable power makes it more challenging to monitor and manage power grids. The transition to renewable power and the associated fragmentation and localization of power sources means grid vulnerabilities are more widely dispersed. Power lines will also have to be upgraded or extended to connect to renewable sources, vastly expanding the array of infrastructure that requires inspection and maintenance.
The combination of rising extreme weather events, decentralized energy generation and expanding networks increases the range and scope of vulnerabilities across power grids. This creates an urgent need to move away from reactive operations and maintenance management towards proactive grid resilience based on intelligent data from the field and the latest in Living Digital Twin (LDT) technology.
The blind spots behind the blackouts
Part of the challenge in creating resilient grids is that the fragmentation of power lines is reflected in a fragmented array of inspection data from sensors and satellites to human workers and drones. This data is often collected in mutually incompatible formats and is not rapidly centralized where it could cumulatively reveal combined hazards. For example, many utility asset intelligence systems are not platform-agnostic and cannot instantly integrate the full array of live data from line workers to satellites.
Many current inspection assets are also unable to provide a sufficiently holistic or detailed overview of hazards. Some utilities are still using line workers to search for stray vegetation, painstakingly visually matching each location with their mental knowledge of all the hazards associated with various tree species. Helicopter inspection teams are often used for aerial inspection but, used alone, leave significant blind spots in an organization’s risk picture. These inspection methods, constrained by limited human resources, range and scope cannot cope with the fast-paced, fluctuating threat landscape utilities now face.
Without comprehensive, current and accurate data from all available sources, power firms cannot instantly absorb information from the ‘edge’ of a network to quickly pinpoint or predict hazards. The lack of continuously updated – or live - inspection data further hampers organizations from effectively targeting repairs, maintenance and upgrades. Intelligent use of public safety power shutoff, where power companies deliberately turn off the lights to avert fire hazards, also relies on rich, real-time, location-based field data. Without comprehensive data on damaged or degraded assets, organizations cannot swiftly institutionalize insights to reinstate power or react with more localized shut-offs, nor can historical data be used to mitigate future events and update network risk models.
Some utilities are using more advanced inspection tools from air vehicles but too often they use centralized, closed network maps which cannot integrate data from all available sources to provide a joined-up risk picture. Merging meteorological, historical incident statistics, tree species and healthiness analysis and other data is vital to identify the subtle interdependencies between power grids and neighboring hazards. For example, overlaying local weather and satellite vegetation data, with real-time network risk monitoring, onto geospatial network information can help highlight the way in which increasing high winds could push neighboring trees into power lines. Holistic hazard information is also critical to help digital twins not only monitor current threats but also model future hazards.
From reactive to resilient
Utilities need to move from a reactive approach based on repair and recovery towards a more proactive risk management approach based on rich, real-time data from diverse sources. This involves moving away from centralized, siloed network maps and instead adopting platform agnostic software capable of instantly integrating hazard data, such as network fault indicators, field inspection reports and customers complaints. A centralized source of data allows businesses to be more reactive, forming a consolidated view during emergency situations so that needed actions and repairs can be coordinated without delay, remotely, allowing recovery of electricity distribution to happen as soon as possible.
Crucially, they need open platforms capable of drawing on the full array of modern inspection assets. For example, drones with high-resolution infrared sensors can cut the cost and expand the scope of aerial inspection, providing more rich and regular data. This would help utilities monitor and manage hazards across an expanding array of power grid infrastructure connecting to decentralized renewable power sources. Incorporating data from automated aerial inspections would enable damage, degradation or hazards to be rapidly pinpointed and enable more effective targeting of repairs and maintenance.
The next stage of digital twin technology: Living Digital Twins
Importantly, comprehensive and current data from the field enables the creation of a Living Digital Twin: a detailed, real-time 4-dimensional replica of a utility’s assets. It utilizes machine learning algorithms to integrate continuous updating data sources - air vehicles, weather information, network incidents and field crews, for example - and when that data is added it becomes living, combining the data feed into the risk assessment model with change detection, to prioritize real-time, remedial action that can be taken before an issue arises.
Geological, ecological or meteorological data from air vehicles, such as satellites, drones and sensors, can be merged with grid maps to model and mitigate against future extreme weather scenarios. For example, data on warmer weather caused by climate change could be matched with winds and vegetation data to create multi-layered maps predicting where wind could blow sparks onto parched vegetation.
LIDAR radar data mapping the location of vegetation can now be merged with RGB (red, green, blue) imaging data to illuminate color and detail, and hyperspectral sensors which measure parts of the electromagnetic spectrum invisible to the human eye. This populates the LDT with a rich detailed view of the location, type and behavior of vegetation in relation to power lines. Neural networks could automatically scour this data to identify hazards such as trees above a certain height in areas with high windspeeds or power lines close to vegetation in tinder box conditions. Feeding this data into 4D digital twin models also enables grid upgrades to be planned to reduce cost and risk and avoid environmental hazards.
Recent advances in graph neural networks (GNNs as well as Transformer based models) have increased the range of possibilities for machine learning and AI, even with sparse point clouds and multimodal and highly dimensional data. Platform-agnostic integrations of multimodal data into comprehensive AI models which are able to take advantage of a variety of modalities simultaneously may result in improved results when it comes to three-dimensional line-corridor object localization, and their classification into various classes; be it species of intrusive and high-risk vegetation or the various defective states of powerline components.
Alternatively, it might well be the case that using LiDAR for resolvable component localization, HSI for spectral vegetation classification and RGB for texture and spatial morphology-based component defect classification, separately. Each with specialized AI models will be the optimal solution to negation of the destructive effects of extreme weather. Regardless of what our future research will reveal, a holistic combination of all these data sources is essential, be it at the Machine Learning model level, or during the compilation of final actionable insights.
The frequency and ferocity of extreme weather events looks unlikely to abate anytime soon. So, we must all adapt. The key to making grids resilient to fast-fluctuating climate threats is to adopt open asset intelligence ecosystems capable of integrating threat intelligence from diverse sources. This provides smart, responsive power grids that rapidly adapt to real-time data from the field and can ultimately predict and prevent threats before they arise.
Learn more in Sharper Shape’s latest industry paper, Powerline inspection in a warmer world: what to expect and how to prepare.
About the Author
Chris Beaufait
Chris Beaufait is CEO at Sharper Shape.