GIS Boosts Grid Modernization
Grid modernization is about greater resiliency. Why is that? Today’s grid is under attack. Storms, fires, earthquakes and landslides are hammering the grid. Droughts are killing our forests, leading to greater insect infestation, more dead trees and more outages. Villains are intent on taking the grid down. The grid is old. Finally, customers have become more and more reliant on the grid.
The grid needs to be tougher.
How is a utility with shrinking revenues, rising costs and skyrocketing customer demands strengthening resiliency?
Smart technology.
Utilities have used Geographic Information System (GIS) for their grid data for years. Yet, they use GIS mainly as a system of record. That’s been good. Today’s modern GIS, such as Esri’s ArcGIS platform has so much more capability — that expertise is needed to boost resiliency.
Bill Meehan, director of utility at Esri, the world’s largest provider of GIS, spent nearly 20 years as a senior executive at a major power company. He believes there are three ways to boost the resiliency of the grid. “We need to do a better job of modeling the grid itself. We must sharpen our focus on grid vulnerability, both predictive and in real time. Finally, we need to create a shared understanding of the grid with all its stakeholders — utilities, customers, media and government.”
That’s what a modern GIS can do. Nearly everything a power company does involves location — location of assets, crews, customers, failures, and events. That’s why GIS, as the foundation for Grid Modernization, makes so much sense.
GIS inherited its connectivity model from legacy mapping systems. In the old days, it was more important how assets looked on a map. It was less important how assets really worked. Even today, utilities rarely represent the structural elements of the grid - vaults, manholes, transmission towers, duct banks and conduits. Substation models are kept in separate systems. Utilities mostly represent high voltage transmission lines schematically and they don’t have one single, accurate digital model of the grid.
Esri’s new ArcGIS Utility Network Management Extension, nicknamed, the Utility Network, changes all that.
It has the tools to model networks as they really are on the ground. It models terminals, complex switches and neutral connections. It models structural elements and their real-world relationship to the electrical devices.
The utility network has three features:
- Real-world modeling
- Visualization in 2D and 3D
- Sharing of network functionality on any device (desktop, the web, tablets, smart phones)
Esri designed the utility network to align around global modeling standards. Those include the Common Information Model (CIM). This eases collaboration with other utility systems, such as Advanced Distribution Management Systems (ADMS).
Better and more complete modeling of the grid provides the first element to a stronger grid modernization program.
Having a great model of the grid is a prerequisite for understanding vulnerability. Utilities also need greater insight into the behavior of the grid - both in relationship to its surroundings and its threats. Again, location plays a strong role here as well. To better harden the grid, utilities must understand, what may happen to it — a predictive model. It also needs to know what is happening to it right now – a real time model.
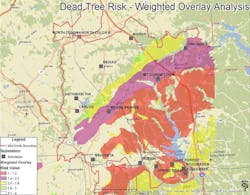
Spatial analytics is a common feature of GIS. It has been used extensively in many industries. Those include city planning, Intel, defense and retail. Yet, it rarely has been used in utilities. Spatial analysis gives utilities the ability to see patterns and gain insight. For example, a utility can map weather and lightning, potential flooding, historic physical threats, crime areas, equipment failure locations and many more factors. They can then combine and weigh those factors to provide a focused area where vulnerability is highest.
Mid-South Synergy, an electric utility in Texas, had a resiliency problem. Its 3,000 miles of electric distribution lines overlay the Sam Houston National Forest. Dead trees caused most of the company’s outages. Consuming free U.S. Geological Survey (USGS) soil and vegetation map layer data into their GIS helped them identify the areas of greatest risk. They found that tall pine trees in dry soil types posed the greatest hazard. Using spatial analytics, they determined the probability of dead trees falling on the utility’s electric wires across the territory. Utility staff focused on removing dead trees in high-risk areas. They reduced tree outages by 60%. See image above.
Utilities can also perform real-time spatial analysis. GIS can consume information from any streaming data source. These sources include internal real-time systems such as SCADA, ADMS and Advanced Metering Infrastructure (AMI). The technology of IoT (internet of things) provides even more information. The key is the location of IoT sensors. Consider each source of real time data as a layer in the GIS. Utilities can combine these layers using spatial analytics to provide insight into what’s happening right now. Sensors such as flood gauges, video feeds, audio alerts, smoke alarms, traffic alarms all can add to real-time location intelligence.
ArcGIS incorporates artificial Intelligence (AI) and machine learning (ML) to increase the effectiveness of spatial analysis.
As Meehan stated, getting the information to all stakeholders is essential. GIS is no longer confined to the back office. The ArcGIS platform takes its cue from social media. The ArcGIS platform gives utilities, network functionality, results of spatial analysis and situational awareness anywhere on any device. ArcGIS’s extensive use of cloud technology (both the public cloud an on-premise cloud technology) make this happen. Corporate executives, customers, the media and government can know immediately the state of the grid.
The three elements are needed for Grid Modernization:
- Real-world modeling of the grid
- The ability to model grid vulnerability
- The ability to share the state of the grid in real time
This is what GIS does.
About the Author
Gordon Feller
Europe Insights Editor
Gordon Feller has spent the past 40 years working to create a sustainable energy future. Among his many roles, he served as an Obama appointee on a select U.S. Federal Commission, established by the U.S. Congress to focus on recommending actions to address the future of utilities, the grid, EVs and storage.