Time-Based Maintenance in UVM
Download the Research Report
The UVM survey was completed by 30 United States electric utilities in March 2024. This work is a continuation of long-standing utility vegetation management surveys performed by Eocene Environmental Group (formerly CNUC) (Cieslewicz & Porter, 2010; Hauer & Miller, 2021; Porter &
Cohn, 2014, 2016).
The 2024 Utilities & Vegetation Management in the United States survey conducted by Eocene Environmental Group describes the current state of utility forestry tree activities and operations.
Click here to download the full report.
In 2024, Eocene Environmental Group completed its latest utility vegetation management (UVM) survey. Its predecessor was completed in 2019, yielding insight into recent trends.
Questions were designed to quantify respondent utility characteristics, budgets, approaches to program and personnel management, utility forest attributes and integrated vegetation management (IVM) practices. These results document 2023 as a base year, with the goal of describing what utilities were undertaking and accomplishing in UVM at that time.
A sample of 617 utilities were identified for survey distribution using a combined list from previous Eocene Environmental Group surveys, an online database of electrical cooperatives and the Arbor Day Foundation Tree Line USA database. A total of 47 questionnaires were undeliverable, leaving a distribution list of 570 possible participants. Responses were submitted from 30 utilities, for a 5.3% return rate. Responding utilities accounted for more than 22 million customers, 40,000 miles of transmission, nearly 10,000 miles of sub-transmission and 384,000 miles of distribution lines.
The responses were analyzed by the mean, defined as the arithmetic mean or the sum of values divided by the total responses. The standard error (SE) of the mean was used to denote an estimate of how far the sample mean is likely to be from the population mean. For example, if the current length of a time-based vegetation management cycle is a mean 4.25 (0.38 SE) years, then the expected population mean is between 3.87 and 4.63.
In many cases the survey used a five-point Likert scale to derive mean index scores. An example of its application includes one to strongly disagree, three to neither agree nor disagree and five to strongly agree.
Selected Results
Utility Characteristics
Of responding utilities, 47% were investor-owned and 37% were cooperatives. Municipal, state and public utility districts combined for about 16% of respondents. Nearly all (97%) operated distribution systems, although only 33% were distribution only. One-third were combined distribution, transmission, and generation utilities. The average customer base was 768,000 with a range of 11,000 to 5.5 million. The average distribution system covered 13,000 (4,000 SE) miles, while transmission systems averaged 3,700 (1,200 SE) miles.
Personnel and Wages
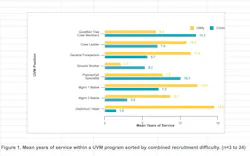
Workforce recruitment and retention remain as critical challenges across the UVM profession. On average, tenures within a UVM program are 32% longer at utilities than with contractor partners. For utilities and contractors, tenure increases with successive levels of responsibility (Fig. 1).
When respondents were asked to rank recruitment difficulty by position, nearly all roles were ranked as neither difficult nor easy to difficult. All tree crew and planner positions were consistently more difficult to recruit compared to management and department-head positions. A mean 2.4 (0.2 SE) levels of management are involved in leading UVM programs.
Department heads and their UVM manager reports share similar yet diverse credentials. The majority held the ISA Certified Arborist credential (69% and 73%, respectively), followed by the ISA Utility Specialist credential (54% and 46%) and a bachelor’s degree in a natural- resource–related field (69% and 54%). Department heads holding natural resource-related bachelor’s degrees increased by 20% from 2019 to the present survey.
Budgets
Returned surveys indicated that routine maintenance accounted for the largest share of budget allocation at about 70% for distribution spend, 73% for subtransmission and 76% for transmission spend. Three-quarters of utilities indicated that non-capital vegetation management (VM) budgets were stable over the past five years, an increase from 54% in 2019.
Nearly half of responding utilities (54%) indicated that their budget was not adequate, signaling no change from 2019 results. Those with inadequate budgets were a mean 30% (7.6 SE) below need.
Technology
Respondents answered questions about different technological components of their UVM programs.
GIS-based software was primarily used for location-specific work history (87%) and customer notification records (78%). A remote sensing interface was the least reported capability at 17%. Of GIS-based work management systems, 71.4% use software provided by a third-party vendor while the remainder use an in-house derived product.
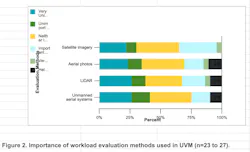
Utilities also rated the importance of workload assessment methods in their programs (Fig. 2).
Overwhelmingly, ground evaluations were rated with the highest importance (4.3 mean index score).
Other evaluation methods (unmanned aerial, aerial photos, satellite imagery, and LiDAR) ranged from unimportant to neither important or unimportant.
Communication
Pre-planning UVM work for responding utilities was conducted ahead of tree crews 87% of the time, consistent with findings from the 2019 UVM survey. This work is commonly performed by non–tree crew personnel, including contract workers (49%) and utility employees (27%), while tree crew members performed pre-planning far less frequently (14%).
Nearly half of utilities (48%) tracked customer complaints, which are most often attributed to worksite tidiness (21%), aesthetics (20%), and improper notification (16%). Complaints pertaining to crew rudeness (4%), unauthorized herbicide application (3%), and unauthorized tree removal (2%) were less common.
Work Scheduling
Time‑based cycle strategies were cited as the predominant scheduling approach by 62% of utilities, lasting an average of 4.3 years (0.4 SE). In 2019, 89% of respondents reported that they used time-based cycles, lasting an average of 4.5 years (0.2 SE). Only 7% of utilities reported artificial‑intelligence‑based cycles as their predominant approach, while condition‑based (17%) and reliability‑based (24%) comprised the middle. In 2019, 3% of utilities described their time‑based cycles as having a reliability focus, though they were not asked about condition‑based vegetation management. For some utilities (31%), location or work type drove variable length cycles.
Utility Forest Metrics
Only 20% of the 29 responding utilities reported estimates of how many trees are in their distribution utility forest, with an average of roughly 1.2 million trees (422K SE). While 83% of respondents track the amount of work completed on their system, the majority (58%) indicated they do not track tree taxonomy.
Among those recording taxonomy, 80% track by common name, 30% by genus, and 10% by species. Tree size was tracked by 56% of responding utilities, all of which tracked diameter at breast height (DBH). DBH ranges were favored (80.0%) over direct measurements. Additionally, 78% of utilities reported using DBH to define brush. While a wide range is used, the most frequently occurring max DBH was 4 inches (43%), consistent with findings by Cieslewicz & Porter (2010) .
Integrated Vegetation Management
Only 36% of utilities implement work using action thresholds, defined in the Integrated Vegetation Management BMP (Miller, 2021) as the level of incompatible plant pressure where vegetation management should occur to prevent vegetation from reaching tolerance levels. Eighty percent of those using action thresholds managed transmission programs, while most utilities who did not use action thresholds managed only distribution and generation programs.
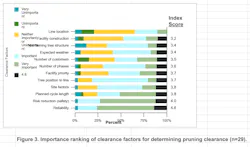
At the time of maintenance, 16% (4 SE) of trees showed signs of being in contact with conductors and 19% (6 SE) of trees were over-hanging the line. Respondents were asked to rate the importance of different clearance factors, emphasizing the importance of both reliability and risk reduction with mean index scores of 4.6 (important to very important)
(Fig. 3). Less important clearance factors included line location and maintaining tree structure. The practice of “ground- to- sky” pruning was reportedly used by 53% of utilities.
Four years prior to this survey, the Utility Tree Risk Assessment Best Management Practices were published (Goodfellow, 2020) . Adoption into UVM programs was noted by 43% of respondents.
Mechanical cutting was employed by 66% of utilities, accounting for a mean 13% (5 SE) of budgets where used. Twenty-four percent of utilities indicated using tree growth regulators in their programs.
Cultural vegetation control methods were ranked on their importance. Only wire-border zone implementation ranked above neutral. Methods such as hydroseeding, cover type conversion, and seeding were all ranked between unimportant to neutral.
When asked about different herbicide application techniques, low-volume foliar, stump treatment and bare ground were the only techniques ranked above neutral on a 1-5 importance scale. Third-party applicators conducted most herbicide work (42%), followed by a VM contractor specifically assigned to herbicide operations (34%), and tree crew members (27%).
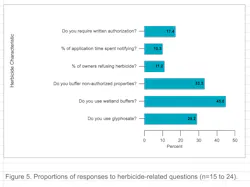
Utilities were also asked about general herbicide program characteristics (Fig. 4), noting the proportions of utilities requiring written authorization (17%), property owners refusing application (11%), and respondents using glyphosate use (29%).
Quality Assurance
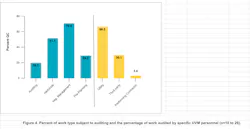
Quality assurance (QA) is a central component in UVM programs, with 87% of programs conducting postwork audits to validate completed VM activities. In 2023, utility personnel were primarily responsible for auditing (67%). QA was also supplemented by contracted auditors (30%) but rarely by tree crew members (3%).
Utilities reported a mix of audit structures (Fig. 5). Complete, 100% field audits were reportedly used by 61% of utilities. Sample-based windshield audits were used by 42% of respondents and reviewed an average of 37% of completed work.
Fewer utilities audited using remote-sensing tools such as LiDAR (7%) or satellite imagery (7%). The level of quality control varied by work type, with greater focus on vegetation management operations (71%), followed by herbicide application (52%), preplanning (29%), and auditing functions (20%).
Summary
The 2024 Utilities & Vegetation Management in the United States survey describes the current state of utility forestry tree activities and operations. This study drew on the responses of 30 utilities covering 22 million customers and 478,000 line miles.
Key findings included that more than half of utilities reported inadequate funding levels to support their UVM programs. Challenges in the recruitment and retention of key UVM field personnel persist, specifically for tree crew members and planners.
Amid rapid technological advancements in UVM, ground-based methods were ranked as most important in workload evaluation strategy and auditing strategy. Action thresholds were not widely adopted in UVM programs (36%) at a time when 17% of utilities reported using condition-based maintenance strategies.
Both reliability and safety are the driving factors for determining clearance distances, given nearly equal importance by respondents.
This study contributes to a body of surveys dating back to 2002 and helps set the stage for future survey content and objectives that expand the body of knowledge in UVM.
Click here to view the full report.
About the Author
Seth Blair
Seth Blair ([email protected]) is the research and development manager at Eocene Environmental Group. He holds a Bachelor of Science in forestry from West Virginia University and a Master of Science in environmental horticulture from the University of Florida. Seth has been involved in utility
vegetation management and urban forestry for more than a decade.
Rich Hauer
Rich Hauer ([email protected]) is the director of urban forestry at Eocene Environmental Group and Professor Emeritus of Urban Forestry at the University of Wisconsin-Stevens Point.