More Than 20% of Outages Attributed to Vegetation: UVM Survey
This summer, CNUC finished its most recent utility vegetation management (UVM) survey in cooperation with Dr. Richard Hauer of the University of Wisconsin – Stevens Point. The survey was developed in November of 2019 following the outline of Utility Vegetation Management: The Utility Specialist Certification Study Guide (Miller and Kempter 2018). Questions were designed to quantify respondent company characteristics and their approach to UVM safety, program management, pruning, integrated vegetation management (IVM), electrical operations, storm response and communications. The results document 2019 as a base year, with the idea of describing what utilities were undertaking and accomplishing in UVM at that time.
Rather than originating online, the questionnaire was mailed to 210 utilities using a combined list from CNUC and the Arbor Day Foundation Tree Line USA database, with a return deadline of early March 2020. Sixteen questionnaires had either invalid addresses or were returned blank, making the distribution list total 194 potential participants. 71 utilities responded, including six from Canada and 65 from the United States, for a 36.6% return rate. Responding utilities accounted for over 52 million customers, 107,000 miles of transmission, nearly 80,000 miles of sub transmission and 1.1 million miles of distribution lines.
The responses were statistically analyzed by the mean, defined as the arithmetic mean or the sum of values divided by the total responses. The range is the value from the lowest to highest reported values for a question. The standard error of the mean (SE) was used to denote an estimate of how far the sample mean is likely to be from the population mean. For example, if the current length of the vegetation management cycle has a mean of 4.5 years with a standard error of 0.18 years, any cycle length longer than 4.68 years or shorter than 4.32 years would be statistically outside of the average length. In many cases the survey used a five-point Likert scale. An example of its application could be one to strongly disagree, three to neither agree nor disagree and five to strongly agree.
Selected Results
The results of the survey have been published in a comprehensive report available at: www.wearecnuc.com/uvm-survey.
Below are select findings you might find particularly interesting.
Utility Characteristics
38% of responding utilities were investor-owned (IOU), 31% were municipal or public utility districts and 20% were cooperatives (the remainder answered other). Nearly all (97%) operated distribution systems, although only 28% were distribution only. 41% were distribution, transmission and generation companies. The average customer base of responding utilities was 756,000 with a range of 3500 to 7.8 million. The average distribution system covered 16,523 miles with a standard error of 3,514 miles.
Safety
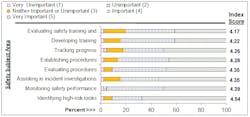
Safety was an important to very important aspect for many subject areas (Figure 1). Nearly all responding utilities (97%) sought to learn from safety incidents and close calls by making sure they were communicated throughout the organization. Only 30% of responding utilities used a third-party safety administrator (like ISNetworld), although 60% of utilities with over 10,000 miles of distribution line and 71% of investor-owned utilities (IOUs) did. Responding utilities were largely ambivalent about Utility Arborist Association (UAA) safety summits, rating them as neutral (3.1) on a five-point scale (IOUs rated them at 3.2). Fewer than half (44.4%) of responding utilities subjected employees who committed unintentional safety errors to discipline, although 95.2% reported that they subjected intentional safety rule violations to progressive discipline.
Nearly all responding utilities (97%) communicate lessons learned from safety incidents throughout their organizations. Utilities used multiple methods of communicating safety messages. 89% used safety meetings, 65% safety stand downs, 56% job briefings and 28% used conferenced calls. A quarter of respondents replied “other”, which was mostly use of email. For IOUs, 75% used safety meetings and stand downs, 54% job briefings, and 50% conference calls. Safety committees meet an average of 11 times a year for responding utilities, but only 9.5 times at IOUs. 70% of all utilities pay the time for their contractor’s safety meetings, but only 59.1% IOUs. Responding utilities considered the American National Standard for Tree Care Operations to be important to very important (4.5 out of 5).
Program Management
All responding utilities had centralized programs. Nearly 80% were centralized as a single department, 17.4% were centralized by program (distribution or transmission, for example) and the remainder were centralized by other structures. For IOUs, early all (92.9%) had a department head.
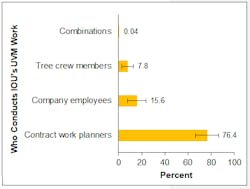
Almost 90% of responding utilities pre-planned or inspected work ahead of tree crews. 52% used contract workers, 39.1% used company employees and 5.3% used tree crews. 92.6% of responding IOUs inspect work ahead of tree crews. 76.6% use contractors, 15.6% inhouse employees and 7.8% deploy tree crews for the purpose (Figure 2).
All the utilities conducted some type of quality assurance or quality control. Responding utilities spent an average of $27 million (± $7 million) annually on UVM in 2018. Over half (52.9%) indicated their UVM budget was inadequate.
Pruning
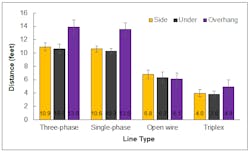
Returned surveys indicated an average of 21.3% of trees were in contact with distribution lines at the time of work. The average side and under distribution clearance after work was 10.9 and 10.6 feet for three and single-phase lines respectively, with overhang being three feet more (Figure 3). The most important reasons utilities expressed for clearing trees from distribution lines were reliability (4.47 out of 5) and risk reduction (4.45). Further they considered ANSI A300, Part 1 (4.52) and the 2004 ISA Utility Pruning BMP (Kempter) (4.44) as the most important authorities for developing specifications.
Integrated Vegetation Management
Safety and service reliability (both at 3.34) were the most important reasons given for IVM programs. Environmental stewardship was the least important (2.33). Responding utilities indicated that the most important method for conducting workload evaluations were ground surveys (4.69), while LiDAR (2.62) and unmanned aerial systems (2.62) were considered least important. ANSI A300 Part 7 was ranked as the most important reference to incorporate into IVM programs (4.12), followed by the ISA best management practice for IVM (3.99) (Miller 2014). Nearly 80% of responding utilities said that the 2011 ISA tree risk assessment best management practice (Smiley, Matheny and Lilly) was unimportant to their UVM programs. This was before the UAA and ISA produced a tree risk assessment specifically for utilities (Goodfellow 2020).
Electrical Operations
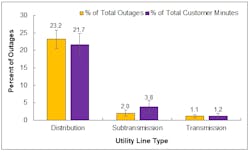
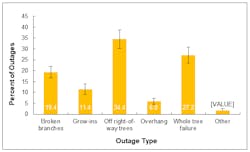
64% had the same UVM strategy for single and three-phase lines. Responding utilities reported an average of 23.2% of distribution outages were caused by vegetation (Figure 4). Of those, over 60% were from off right-of-way trees (34.4%) and whole tree failure (27.2%) (Figure 5). Utilities valued greater action thresholds on three-phase lines (4.13) and greater clearance (4.08) as the most important methods to decrease vegetation-related outages.
Storm Response
Responding utilities ranked an emergency response center (4.31) as the most important storm-response strategy, followed by pre-storm communication checks (4.17) and an incident command system (4.16). They ranked safety (4.96), electric hazard communication protocol (4.57), supervision (4.56) and fatigue (4.55) all as very important considerations in storm response.
Communication
Most utilities use multiple approaches to communicate with customers. 57% used inhouse employees and 55.7% used contractors. 50% also used tree crew members to communicate with customers. Mail (14.3%), phone messages (14.3%) and door hangers (8.6%) were used less frequently. Apart from face-to-face communications, brochures (3.57) and social media (3.45) were the most important communication strategies.
Summary
The 2019 Utilities & Vegetation Management in North America survey is a collaboration between CNUC and the University of Wisconsin – Stevens Point. It describes the current state of utility forestry tree activities and operations. This study drew from a list of 196 utilities that was combined from a historical CNUC list and Tree Line USA recipients from the Arbor Day Foundation. Of them, 71 or 36.6% returned surveys. Responding utilities covered over 52 million customers, along with 107,000 miles of transmission, nearly 80,000 miles of sub transmission and 1.1 million miles of distribution lines.
Important findings included 97% of responding UVM programs learn from safety incidents, but were not enthusiastic on UAA Safety Summits. Nearly 80% of responding utilities had centralized UVM programs. Over 21% of trees were in contact with distribution lines at the time of work. Safety and service reliability were the prominent reasons responding utilities used UVM, while 23.2% of outages were attributable to vegetation. Emergency response centers were a prominent storm response strategy and safety was the most important consideration. UVM programs use inhouse, or inhouse arborists to communicate with customers with brochures and social media common in non-face-to-face communication.
The study contributes to a body of CNUC surveys that date back nearly 20 years. It sets the stage for future UVM industry collaborations between CNUC and the University of Wisconsin – Stevens Point.
References
Goodfellow, J.W. 2020. Utility Tree Risk Assessment: Best Management Companion publication to ANSI A300 Part 9: Tree, Shrub, and Other Woody Plant Management – Standards Practices (Tree Risk Assessment a. Tree Failure). International Society of Arboriculture. Atlanta, GA. 95 pp.
Hauer, R.J. and Miller, R.H. 2021. Utilities & Vegetation Management n North America: Results from a 2019 Utility Forestry Census of Tree Activities & Operations. Special Publication 21-1. College of Natural Resources. University of Wisconsin – Stevens Point. 69 pp.
Hauer, R.J. and Peterson, W.D. 2016. Municipal Tree Care and Management in the United States: A 2014 Urban & Community Forestry Census of Tree Activities. Special Publication 16-1, College of Natural Resources, University of Wisconsin – Stevens Point. 71 pp.
Kempter, G. 2004. Best Management Practices: Utility Pruning of Trees. International Society of Arboriculture. Champaign, IL. 22 pp.
Miller, R.H. 2014. Best Management Practices: Integrated Vegetation Management. International Society of Arboriculture. Champaign, IL. 52 pp.
Miller, R.H. and Kempter, G. 2018. Utility Vegetation Management: The Utility Specialist Certification Study Guide. International Society of Arboriculture. Champaign, IL. 266. pp
Smiley, T. Matheny, N., Lilly, S. 2011. Best Management Practices: Tree Risk Assessment. International Society of Arboriculture. Champaign, IL. 81. pp.
About the Author
Randall Miller
Randall H. Miller ([email protected]) is the director of research and development for Eocene Environmental Group.
Richard Hauer
Richard Hauer, Professor of Urban and Community Forestry at University of Wisconsin-Stevens Point
