Subcomponents for Key Element 1: Dissolved Gas-in-oil Analysis (DGA)
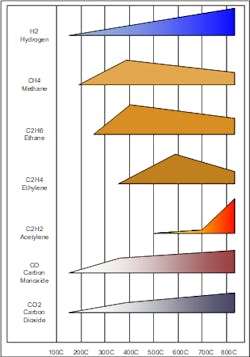
Gases dissolve in oil because of excessive electrical and/or thermal energy breaks off fragments of the molecules that make up the insulation system. Even under normal operating conditions the insulation system undergoes some electrical and heat stress. But, under fault conditions, the stress substantially increases. If the energy is concentrated in a small area, the temperature of that small area dramatically increases. The fault temperature and the gas formation rate are illustrated in Figure 1 below. Although this chart is an approximation, it can be seen that faults in a transformer are temperature related and can be categorized using empirical and statistical analysis. The category can give a clue to what corrective actions are needed or estimate the severity of the fault. It may suggest more frequent sampling, infrared scan, or de-energizing the transformer to perform a full battery of electrical test. These test results along with any follow-up investigations are aggerated and produce the first element for the Transformer Health Index.
The IEEE C57.104 [1] and IEC 60599 [2] are two documents that govern the interpretation for DGA. These have been developed from empirical data and experience based on findings of case studies over many years. Also, various methodologies using ratios and/or plots have been developed to classify fault types and their severity. The most widely used methods include IEC 599, Dornenburg, Rogers Ratio, Nomograph, Duval’s Triangle, and Duval’s Pentagram [3],[4]. These methods help simplify the understanding and the classification of faults.
At the utility, the process begins by taking a syringe sample from each transformer periodically. DGA samples are collected in 50cc clear glass syringes with matching barrels and cylinders. The matching barrels and cylinders minimize the loss of the gas molecules. Also, proper flushing of the sample port and syringe is vital to obtaining a representative sample. Immediately after taking the sample, the small air bubbles should be purged from the syringe. Next, return the syringe to its protected box to avoid physical damage and prevent the sun’s ultraviolet light from reaching the sample. Only one syringe is needed per transformer. Samples are sent to the lab where the gases are extracted and analyzed in a gas chromatograph (GC). The GC reports the various gases in ppm. The fault gases fall into three groups which are “arcing”, “hot metal” and “insulation breakdown”. The atmospheric gases of oxygen and nitrogen are also reported by the GC.
The arcing gas is acetylene(C2H2). Acetylene can be generated in the oil starting at 500oC because of extremely overheated metal in contact with the oil. But, at temperatures greater than 700oC, which are associated with an arc, there is a sharp increase in the production rate. Acetylene produced by an arc is the most serious condition that can be found inside a transformer and should be investigated immediately. The investigation starts with looking at the ppm value of hydrogen relative to the acetylene. An arc always produces hydrogen along with acetylene. In the case where the hydrogen level is low (less than the IEEE C57.104 - Condition 1 limit of 100ppm), the fault occurred in the past and is not ongoing. See Figure 3 below. This is known because hydrogen is the least soluble gas in the oil which is around 7% at 25oC. This allows hydrogen to escape from the oil very easily after an event that produced an arc. Acetylene is the most soluble gas which is 400% at 25oC. Acetylene will tend to stay in the oil long after a fault occurs. The solubilities of other fault gases fall in between these solubilities. It can be concluded that if hydrogen is present along with other fault gases and hydrogen is increasing over time, a fault is active and growing. The presence of arcing should be taken very seriously and swift action should follow. Actions should include a confirmation sample, infrared scan, visual inspection, review of the most recent operating events, and a review of the most recent electrical test data. Always use caution on all activities that involve being near a transformer that is suspect.
The “hot metal” gases are methane (CH4), ethane (C2H6), and ethylene (C2H4). If one of the gases exceeds the IEEE C57.104 – condition 1 limit, then the data indicates that hot metal is in contact with the oil. Possible locations include the following areas: flux shield, core steal, tap changer contacts, and bolted/crimped connections. In some cases, the faults may be located in the auxiliary equipment inside the transformer, such as a current transformer or pump. The severity of the overheating can be determined by the amount, rate of increase over time and the ratio of the individual fault gases.
The “insulation breakdown” gases are carbon monoxide (CO) and carbon dioxide (CO2). These gases are generated when the paper, pressboard or wood are broken down [5]. The insulation system relates to the transformer the same way the skeleton relates to the human body. If one of the gases is greater than the IEEE C57.104 – condition 1 limit and Carbon Dioxide to Carbon Monoxide ratio generally falls greater than 10 to 1 or less than 3 to 1, the data indicates the cellulose insulation is breaking down. The damage of the overheating can be determined by the amount, rate of increase, and the ratio of the two gases. Ratios over 10 to 1 occur when there is general overheating because of overloading or insufficient cooling. Ratios below 3 to 1 are typically when the cellulose is in contact with hot metal or associated with an area of arcing. Trending the ratio over time speaks volumes about the longevity of the transformer especially if the ratio is greater than 10 to 1 and constantly increasing. Damage to the insulation system is more serious because if it is left uncorrected, it becomes harder to correct. Thus, the life of the transformer will be shortened. It has been said by many that “the life of the insulation is the life of the transformer.”
Subcomponents for Key Element 2: Oil Quality
Oil quality is a term to encompass a set of chemical and physical properties describing the condition of the insulating oil. Specifying and purchasing oil has a long list of test requirements. But the focus of Key Element 2 are seven tests. The results of these tests give great insight to the internal condition of the transformer and are typically part of the annual maintenance program. These test results are aggerated and produce the second element for the Transformer Health Index. This helps Engineers and Subject Matter Experts (SME) know where to focus the resources of the maintenance and test crews.
The insulation system is constantly under attack from three enemies (oxygen, heat, and moisture). When moisture and oxygen enter the transformer, it causes the oil and paper insulation system to begin the breakdown process. As the transformer undergoes more stress such as overloading or the deterioration of the seals in the oil preservation system, there is ever-increasing damage to the oil and paper insulation system. The breakdown produces acids, metal soaps, sludge, and other polar compounds. If left unchecked, the insulation system enters a death spiral. This can be prevented by keeping an eye on the results from the oil quality test.
At the utility, the process begins by taking an oil quality sample in a new high density polyethene (HDPE) plastic opaque 1-liter bottle. Utilities have proven, with data and experience, that new HDPE plastic opaque bottles are better than glass bottles that may break. These samples are sent to the lab where the oil properties are tested using ASTM or IEC standardized methods. Routine samples typically include seven tests and only one bottle is required per transformer for all seven tests.
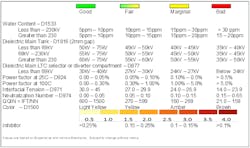
The seven routine oil quality test yield the subcomponents for Key Element 2. They are as follows: Moisture in Oil, Dielectric Breakdown, Power Factor, Interfacial Tension, Neutralization Number or Total Acid Number, Color, Inhibitor Content. These tests are covered in the ASTM and IEC standards.
1) ASTM D1533 IEC 814: Moisture in oil measures the weight of the moisture divided by the weight of the oil. The results are reported in ppm. It is very important to know the temperature of the oil sample when it is collected to determine the relative saturation.
Moisture has a long-term effect that deteriorates the paper and a short-term effect that can cause a flashover in the insulation system under certain conditions. This is because 99% of the moisture is found in the paper. As the transformer heats up, a small amount of moisture slowly migrates from the paper to the oil. Even 0.5% change in the moisture of the paper will cause a major change in the amount of moisture in the oil. Fortunately, the ability of the oil increases, thus the relative saturation stays relatively constant as long as the heating and cooling are slow. The relative saturation is important because a higher saturation percentage causes a lower dielectric breakdown voltage. Also, if the relative saturation is greater than 100%, water will precipitate out of the oil as free water and fall toward the bottom [6]. The water on its way to the bottom may fall across an area of high electrical stress, which would cause a flashover in the transformer. This is most likely to happen on transformers with a high moisture content based on the oil-saturation numbers and if the load drops suddenly such that the transformer oil cools quickly.
2) ASTM D877, ASTM 1816 (1mm and 2mm gap) and IEC 60156: Dielectric breakdown measures the AC voltage at which the oil fails electrically. The results are reported in kilovolts (kV).
ASTM D1816 test cell is a better representation of the internals of a transformer compared to the test cell described in the ASTM D877. The test cell for the ASTM D1816 has a stirrer that keeps the oil circulating much like oil pumps or the convection heating of the oil by the core and coils. Also, the test probes do not have sharp edges emulating the inside of a transformer.
ASTM D877 test cell is a better representation of an oil circuit breaker or a tap changer compartment where the oil is not circulating because of convection or pumps.
3) ASTM D924: Power factor measures the dielectric losses in the oil by taking the cosine of the phase angle of the applied voltage and resulting current. Power factor results are reported in percent and is routinely measured with the oil heated to 25oC.
IEC 247 – Dissipation is similar to power factor where the leakage current through the oil measures the contaminants such as moisture, oxidation products and varnishes.
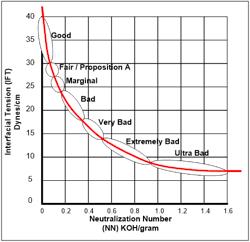
4) ASTM D971: Interfacial tension (IFT) measures the presence of soluble contaminants and oxidation byproducts. Interfacial tension is reported in dynes/cm or mN/M.
5) ASTM D974: Neutralization Number (NN) or Acid Number measures the amount of potassium hydroxide required to neutralize the acid in one gram of oil. NN is expressed in mg KOH/g.
6) ASTM D1500: Color compares the oil color to a series of color standards. Color is reported as a number ranging from 0 to 5 where 0 is almost clear and 5 is dark brown. Darkening of the color is associated contamination of the oil. In most cases the contamination is assumed to be related to oil deterioration but the IFT and NN results are needed to confirm the color results.
7) ASTM D2668: Most mineral oil-filled transformers contain 2,6-ditertiarybutyl para-cresol (DBPC) or 2,6-ditertiary-butyl phenol (DBP) which acts as an oxidation inhibitor. It can be compared with a human taking anti-oxidant vitamins. The oxidation inhibitor declines over time as it performs it job to protect the oil.
Subcomponents for Key Element 3: Age (Degradation Curve)
Age is normally thought of as the difference in time between the date of the analysis minus the manufacture date. In the case of a power transformer, the age is the apparent age because the ageing rate varies according to how well the transformer has been operated and maintained. The best way to understand this Key Element is to review the effects of oxygen, heat and moisture.
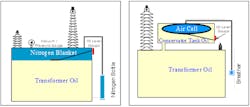
Oxygen and moisture generally enter into a transformer over a long period of time and by the same path. This path is normally through a poorly maintained oil-preservation system. The two most common transformer oil preservation systems are variations of the Nitrogen Blanketed and Conservator Oil Preservation System (COPS). These are illustrated in Figure 7. Any place that oil or nitrogen leaks through will allow a pathway for oxygen and moisture to enter.
Oil quality and offline power-factor testing are the best ways to monitor this issue. In other words, these two enemies of the transformer give warning signs and can be controlled by a good maintenance and test program to maximize the life of the transformer.
Refer back to Figure 2 in part 1 of this article to see how dramatically the temperature effects the transformer’s life expectancy. Heat is the one enemy of the transformer that is not so easily controlled. Although the maintenance program can maintain the cooling system at maximum efficiency, the real challenge deals with the role of the transformer. Category 1: Unit, Common, and Auxiliary Station Service transformers are often running above their rating because as time progresses, more and more load is added. These transformers are typically the first transformers at a plant to be replaced because of failure or the inability to provide for the load. Category 2: Generator Step-up Transformer Units (GSUs) are sized slightly higher than the output of the generator. Therefore, the temperature of the transformer will be elevated when it is in service. Older Hydro GSUs are an exception in this category. As an example, one utility sent out a bid to replace their old hydro GSUs. When the design came back, they were surprised that the new transformer was half the size of the old one. This was because the modern designing tools allow transformers to be constructed just to the point of meeting the specifications. Today the budgets will not allow for over design and therefore the life expectancy will be much less. This can be seen simply by looking at the allowable temperature rise. Manufacturers have moved the maximum temperature rise over ambient (full load) from 55oC to 65oC. For GSUs, utilities could greatly increase the life expectancy with only a moderate increase in cost by going back to specifying the full load maximum 55oC rating. Loads of Category 3: Transmission transformers at substations vary significantly throughout the day and seasons. They work hard during the peaks of the day but rest at night as the load drops. Also, they work hard during summer and winter but get to loaf during spring and fall. Their aging effects come mostly from the cycling of the load. The cycling can be stressful on the gaskets and cause leaks that lead to oxygen and moisture ingress. In general, these transformers have the longest life expectancy because the load factor is the lowest.
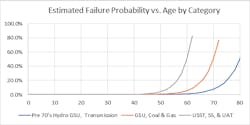
Based on failure data and experience, the graph in Figure 8 has been developed. By understanding the principles discussed above, other categories can be developed. Categories may be developed based on transformer design series, manufacture, application, oil preservation systems, insulation fluid type and other factors.
Subcomponents for Key Element 4: Off-line Routine Electrical Test and On-line Inspections
Off-line electrical test falls into two categories: routine and investigative. Preventive Maintenance (PM) is associated with the routine test and Corrective Maintenance (CM) with the investigative test. In both cases, the transformer must be de-energized and disconnected. At generating stations, the test frequency is usually dictated by the generator outage schedule. These are typically every 18 months to 24months, and are in spring or fall when the power demand is at the lowest. This works well because transformers at the plants have a much higher load factor than the ones in transmission. Therefore, these transformers require more frequent testing. Transmission transformers are the driving force for the outages schedule at the substations. Typically, the testing frequency runs 48 months to 60 months because the load factor is much lower compared with generating plants.
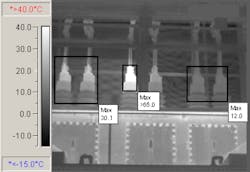
On-line inspection is associated with Predictive Maintenance (PdM). These inspections generally are performed while the transformer is in-service. Infrared scans are best performed during high load periods and on cloudy days.
Utilities have tried for years to move away from routine off-line testing and replace that skill set with electronic monitors. The common name for this is “Transformer Monitoring and Condition Based Maintenance”. But the truth remains that there is nothing that can replace a person who knows how to test and inspect their equipment. Therefore, all good transformer programs have a combination of Off-line electrical test and On-line inspections. The results can be assimilated to compose Key Element 4.
On-line inspections include:
Key Elements 1 and 2 are based on industry standards and are not easily influenced by someone who wants to make a particular transformer stand out such that resources get appropriated to its cause. Since Key Element 3 deals in an actual age and uses categories, it is also hard to manipulate the score on only one transformer. Key Element 4 tests and inspection can be manipulated to allow the scorer to affect the rating on a single transformer. To prevent this, Key Element 4 was developed as a multiplication factor that is applied to the total score generated by the other three key elements. Also, a multiplication factor is assigned a value based on known significant issues that are common problems. These groupings can be changed as well as the multiplier but they are intended to give a consentient scoring methodology based on a particular issue.
The following multiplication factors are applied to the scoring of the other three elements:
THI = (Element 1 + Element 2 + Element 3) X (Multiplication factor associated with the condition below)
Power Factor testing
Investigate Rating on High Side Bushing(s) > 100kV - C1 Power Factor – 50%
Investigate Rating on High Side Bushing(s) > 100kV - C2 Power Factor – 60%
Investigate Rating on Other Bushing(s) C1 Power Factor – 70%
Winding Resistance
Measured Resistance Greater than +/- 5% from Factory Test – 30%
Transformer Ratio
Measured Ratio Greater than +/- 1.0% from Factory Test – 30%
Infrared Inspection
Bushing Cap Temperature Rise Over Ambient > 35C – 30%
Bushing Cap Temperature Rise Over Ambient > 10C and < 34 – 80%
Two or more Blocked Coolers or Radiators – 30%
One Blocked Cooler or Radiator – 80%
Visual Inspection
Pegged Low Oil Level Bushing(s) – 30%
Oil Leak on a Bushing(s) > 100kV – 50%
Low Oil Level High Side Bushing(s) – 70%
Main Tank - Oil Seep (Oil not dripping to the ground) – 90%
Main Tank - Oil Leak (Minor amount of oil hitting the ground) – 80%
Main Tank - Oil Leak (Oil absorbent pads used for oil leaks collection) – 60%
Summary for Part 2
Part 2 of this three-part series has shown an overview of the subcomponents that make up each of the four key elements in the Transformer Health Index (THI) and the collection methodology. However, the main focus of part 2 has been the scoring criteria so that it can be rolled up to the next level. Part 3 will demonstrate how to assemble the scoring to give the overall THI for each transformer in the fleet. Therefore, the combination of all three parts of this article will set the basis for a common language to allow communication from the test and maintenance crews through the SMEs and managers up to the senior managers and executives.
References
[1] IEEE C57.104-2008, “IEEE guide for the interpretation of gases generated in oil-immersed transformers”, IEEE 2008
[2] IEC 60599, “Mineral oil-impregnated electrical equipment in service - Guide to the interpretation of dissolved and free gases analysis”, IEC, 1999
[3] R. Rogers, “IEEE and IEC codes to interpret incipient faults in transformer, using gas in oil analysis,” IEEE Trans. On Electr. Insul. vol.13, no.5, pp.349-354, October 1978.
[4] M. Duval, “Dissolved gas analysis: It can save your transformer,” IEEE Electrical Insulation Magazine, Vol 5, No.6, pp. 22-27, 1989.
[5] Mladen Banovic, P Ramachandran, Navin Rego and Pavel Justiz, “Significance of CO2/CO ratio in dissolved gas analysis”, Transformers Magazine, January 8, 2015.
[6] Lewand, Lance R. “Understanding Water in Transformer Systems”, NETA World, Spring, 2002.
[7] Goff, Mark B. “Keys to a Good Inspection Program”, Inframation Conference, 2002
About the Author
Mark B. Goff
Mark B. Goff is a member of the T&D World Executive Insights Board and is responsible for multiple technical publications. His experience spans a 34-year career at the Tennessee Valley Authority (TVA) — from field test engineer to systems engineer to manager of the Electrical Energy Conversion group in Generation Engineering. He built an effective transformer, breaker, and infrared test program and maintenance support group. He is currently working as an engineering consultant.

