Predictive Analytics to Prevent Cable Failures

ENMAX Power Corp, a utility that owns, operates and maintains the transmission and distribution system in and around Calgary, Alberta, Canada, leveraged geographic information system data, asset management and machine learning to develop a five-phase approach to better cable failure prediction, identification and replacement. ENMAX built a model based on this approach to gain deeper insights into how quickly and under what conditions cables are likely to wear out, making it easier for the utility to replace aging grid components before they interrupt service.
The utility’s operations planning team uses key industry metrics such as the system average interruption duration index (SAIDI) and system average interruption frequency index (SAIFI) to assess system performance. SAIDI represents the total duration of a sustained interruption per average customer while SAIFI represents how often the average customer experiences a sustained interruption, both measured over a predetermined period. For 2018 and 2019, ENMAX’s SAIDI was recorded at 0.62 and 0.42, respectively, and SAIFI at 0.82 and 0.71. This means the average customer experienced a total interruption duration of 0.62 hr in 2018 and 0.42 hr in 2019, with a frequency of 0.82 interruptions in 2018 and 0.71 in 2019.
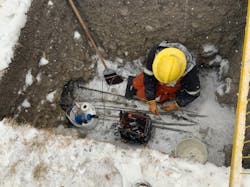
Most interruptions measured by SAIDI and SAIFI occur on ENMAX’s distribution network, which is a mix of nearly 27% overhead line and 73% underground cable assets. Because of the large volume of underground cables in the distribution network, faults on these assets are the highest contributor to SAIDI and SAIFI. When underground cable faults occur, the operations team logs the event in the utility’s outage management system (OMS) and crews locate and isolate the fault to restore service to customers as quickly and safely as possible.
Identifying a Trend
After reviewing data from the OMS and information available from the broader organization, the operations planning team noticed certain areas of the distribution network were experiencing unplanned outages more frequently than others. Cable faults across the 13-kV and 25-kV distribution systems were identified as the main cause. In 2020, the top three contributors to cable fault incidents on the ENMAX system were cable failures (27%), public interference (9%) and animal interference (8%).
Among the cable failure incidents, some of the assets were known to be aging, but the team realized the solution was not as simple as replacing the oldest cables. Other factors required consideration.
Utility asset replacement programs aim to replace assets deemed to be most susceptible to failure, but most programs are based solely on either asset age or laboratory tests. Laboratory tests can be expensive and time consuming, and the age of an asset alone does not necessarily indicate its susceptibility to failure.
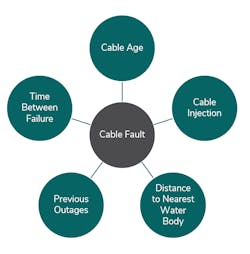
Common reasons for unplanned cable faults include insulation degradation, ingress of moisture and conductor corrosion. The weather in Calgary is possibly a contributing factor, as temperatures range between -30°C (-22°F) in the winter to 30°C (86°F) in the summer. Other features — such as failure history, asset type and manufacturer — also can provide an indication on whether an asset is most likely to fail.
Five-Phase Approach
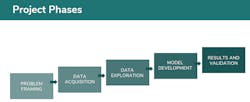
The ENMAX team developed a five-phase approach to better cable failure prediction, identification and replacement:
1. Problem framing
2. Data acquisition
3. Data exploration
4. Model development
5. Results and validation.
The ENMAX team considered several ideas before deciding to use predictive analytics. In addition to the utility’s databases, the team tapped an internal cross-functional group that included asset management, field crews and coordinators, and the geographic information system (GIS) team to gather in-depth information on the cables and contributing factors to potential cable faults.
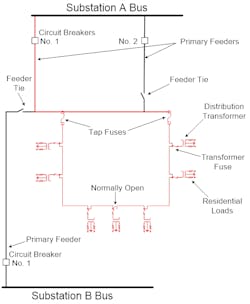
Examining the data and working with other groups across ENMAX, the project team aggregated each cable section to be represented at a fuse level on the underground residential distribution (URD) network. With hundreds of thousands of cable sections to be analyzed, the team condensed this down to about 10,000 fuses. The team used data analytics to rank the underground distribution cables against each other based on fault susceptibility, to identify the cables most likely to experience a fault. Once the team identified data analytics as a solution, they acquired and explored all the data available.
Data Resources
Based on input from other subject matter experts in the utility, the project team used four main sources — two internal and two external — from which to gather the data. Internally, the team sourced ENMAX’s GIS asset management system for physical attributes of the cables, such as burial method, conductor material and cable length. The OMS was used for outage information, fault history and number of customers affected. Externally, the team sourced the city of Calgary’s municipal open data portal to calculate the distance to the nearest body of water for each fuse as well as the weather database to access temperature and precipitation information.
Collectively, the team assembled 13 years of historical information and more than 1.5 million data points. The next step was to take this data and use advanced analytics methods to combine the effect of several factors and determine the assets with the highest fault probability.
Developing a Model
ENMAX was familiar with machine learning, using it for load forecasting and other forms of prediction in its operations. The technique was judged to be acceptable for this project. Machine learning is a subset of artificial intelligence and can be defined as the process of teaching a system a specific task, without being explicitly programmed.
Using open-source libraries, the project team used machine learning algorithms to create a failure susceptibility ranking model for the distribution network cables, considering various asset features and environmental factors. The team then split the data into two sets — a training set and a test set. The training data set was required for the predictive model to learn the top factors that could predict future faults. Data from the period 2007 to 2017 was used to create the trained machine learning model, and data from 2018 to 2019 was used to test the model and analyze the results.
In the development process, the team created both a monthly and an annual trained machine learning model. Both models applied a ranking system like that of online search engines, listing the cables from most likely to least likely to experience a cable fault in that month or year, respectively.
Analyzing the Results
The team entered the test data set into the model and compared the predicted results with the actual faults that occurred over the 2007 to 2019 test period. The results revealed a strong correlation and accuracy in the model’s predictions. On average, 70% of the predicted top cables experienced at least one fault outage.
As expected, the machine learning model could not give the chronological order of the faults, but it could rank ENMAX’s URD network based on fault susceptibility. The model was used to guide the utility’s cable replacement strategy in 2019 and 2020. As a result, ENMAX expects a reduction in the frequency of URD cable faults in the coming years.
However, together with the successful test results, the team identified the model had two limitations:
The first limitation stemmed from the assumption of aggregating cable sections downstream of a fuse as a single entity. Using the average age of all cables installed downstream from the fuse instead of the actual cable section age slightly reduces the training and validation gain, but this assumption was necessary to condense the data.
The second limitation was the absence of chronological order in the rankings. For each monthly or annual ranking, the model does not indicate which fuse would be the first to experience a fault. As a result, it is not possible to know the period before the first and second faults. This can be solved by creating a regression model with its target variable as time between failures. The regression model would require a high degree of data quality to obtain acceptable training and validation accuracy.
Despite its limitations, the model provides greater insight than only considering contributing factors like cable age. As the model learns from more historical data over time, its predictions will get even more accurate.
Data-Driven Decision Making
Data analysis offers a solution that is reproducible across the complete asset infrastructure of a distribution network. It employs complex machine learning and statistical algorithms to extract actionable insights and learnings from historical data. These findings can help utilities to improve their allocation of both financial and human resources to the assets most susceptible to failure, thereby establishing a data-driven decision-making process.
Busayo Akinloye ([email protected]) is an operations planning engineer at ENMAX Power Corp. In this role, Akinloye is responsible for ENMAX’s T&D real-time operations planning and reliability. With almost 10 years of industry experience, he combines subject matter expertise in the utility industry with advanced data analytics and machine learning techniques to improve grid reliability. Akinloye holds a BSEE degree from the University of Manitoba and is a registered professional engineer with the Association of Professional Engineers and Geoscientists of Alberta (APEGA).
Kevin Wan ([email protected]) is an engineer-in-training providing support to ENMAX Power Corp.’s T&D system in the operations planning team. He holds a BSEE degree from the University of Saskatchewan. Wan is an avid programmer and passionate about solving challenging tasks using automation and data analysis. He is skilled in data extract, transform and load (ETL), aggregation and enriching to set the stage for advanced analytics such as machine learning.
About the Author
Busayo Akinloye
Busayo Akinloye ([email protected]) is an operations planning engineer at ENMAX Power Corp. In this role, Akinloye is responsible for ENMAX’s T&D real-time operations planning and reliability. With almost 10 years of industry experience, he combines subject matter expertise in the utility industry with advanced data analytics and machine learning techniques to improve grid reliability. Akinloye holds a BSEE degree from the University of Manitoba and is a registered professional engineer with the Association of Professional Engineers and Geoscientists of Alberta (APEGA).
Kevin Wan
Kevin Wan ([email protected]) is an engineer-in-training providing support to ENMAX Power Corp.’s T&D system in the operations planning team. He holds a BSEE degree from the University of Saskatchewan. Wan is an avid programmer and passionate about solving challenging tasks using automation and data analysis. He is skilled in data extract, transform and load (ETL), aggregation and enriching to set the stage for advanced analytics such as machine learning.