Three Big Decisions to Make Before the Storm Clobbers Your Utility
The storm is heading your way. Weather forecasters are predicting devastating winds and major power failures. Customers are panicked. Grocery stores are running out of bread, milk, and toilet paper. People are putting aside their worry about COVID-19, at least for now.
An electric utility operations manager must make three critical decisions before a big storm hits, by asking the following questions:
- Do I need mutual aid crews?
- How many?
- Where do I deploy them?
Too Much Chaff and Not Enough Wheat
Bob, the operations manager of an electric utility — and my boss at the time — had to decide when to call for mutual aid crews. He was constantly frustrated because making that decision could be very costly. Weather forecasters and news departments always seemed to be alarmists. All too many times, they would predict major consequences — yet the storm often fizzled.
If the mutual aid crews arrived and we didn't need them, Bob would have to explain why he pulled the trigger too soon and wasted money. He had gotten burned by this several times. But if he waited too long, then all the nearby crews would be spoken for. He might then have to get crews from hundreds, if not thousands, of miles away, delaying restoration. He'd then have to explain why he didn't call the crews in time and why restoration would take longer than for our neighboring utilities. He could never win. What Bob didn't have was the information he needed to make the right decision.
Like many operations managers, Bob's problem was to separate the wheat from the chaff. The chaff could be dire warnings, a history of missteps or wrong decisions, gut feelings, or out-of-date data sources. Too often, Bob had too much chaff and not enough wheat to make decisions based on solid, up-to-the-minute data and science.
It turns out that the wheat is:
- A solid assessment of external impacts on the network
- An understanding of network vulnerability
- Predictions of damage
- Real-time situational awareness
External Impact
External impact data to the network include flood maps, fire risk zones, lightning propensity, tornado alleys, historic wind patterns, past rainfall, landslide maps, and snowstorm history. Other sources include data from public safety agencies, water and gas utilities, and public works (street closures, the status of bridges, traffic signals). The real magic is to combine all these sources together as services into a GIS. Seeing them together paints a complete picture of the external impacts. These services can be set up well in advance of a storm.
Utilities can also subscribe to imagery services. These will show the pre-storm status, then the service will be in place for post-storm imagery.
Network Vulnerability
The next step is to determine where the network is weakest to those external impacts. The network is never perfect. Networks have old equipment, there are areas where trees haven't been trimmed in a while. Leaning and rotted out poles and bad guy wires are all too numerous. Areas of historic failures are known. There are nagging, low-priority, open work orders. Like external impacts this information is often scattered among a variety of sources.
Taking all these data sources together in the GIS, utilities can create a digital map showing where the network is the most vulnerable to failure. Tools such as such as ArcGIS Insights make this simple.
Predictions of Damage
Once utilities have the data in one place in their GIS, they can predict where damage is most likely to occur. They can generate risk profiles and various scenarios that allow crews to plan how they would respond under different situations. Utilities can add other factors, such as essential or critical customers, to the GIS. They can even overlay COVID-19 vulnerable populations from readily available data.
This data must be maintained and updated. This is easily done with Esri's Field Operations apps, which provide real-time updating of completed work.
Situational Awareness: Outage Data Initiative
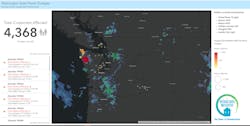
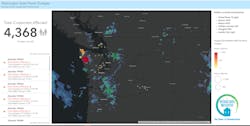
All that preparation work is necessary. However, operations managers still need to decide whether to call for mutual aid, and when and where to deploy crews. If the utilities have the built-in data feeds for external impacts, network vulnerability, and real-time weather feeds, they need to know the situation on the ground before the storm hits. They can bring that data into a dashboard using ArcGIS Dashboards. Sure, they need to know the storm's path. They also must know the state of outages being experienced by their neighboring utilities. This gives them:
- Specific information on the damage neighboring utilities are sustaining.
- Critical input as to mutual aid availability.
The most effective strategy is to seek mutual aid from the closest utilities that are sustaining the least amount of damage.
This leads us to ODI.
What is ODI?
The vision of the Outage Data Initiative (ODI) is to create a nationwide power outage map. It must be detailed, timely, and actionable. The idea is to create and have everyone agree on an outage data standard. By doing that, all parties can have access to a situational awareness dashboard — in other words, a common operating picture (COP) of outages across states and even nations.
The idea is simple. Utilities have many different outage management systems. Some have sophisticated real-time systems. Others, just spreadsheets. There is no standard format for reporting outages. Having all utilities adopt a simple standard for reporting and consuming the data does not force them into adopting a one-size-fits-all technology for managing outages. Instead, it gives all utilities a way of consuming each other's outage information without having to worry about formats. Plus, it simplifies aggregating the data into web-based, GIS dashboards. ODI uses both the International Electrotechnical Commission (IEC) standard called the common information model (CIM) and the National Rural Electric Cooperative Association (NRECA) MultiSpeak data interoperability standard.
Who is leading this initiative?
The Department of Energy (DOE) Office of Electricity's Advanced Grid Research and Development is championing this effort. Oak Ridge National Laboratory (ORNL) is implementing ODI. The first pilot area is in the state of Washington.
How do you get ODI to the GIS?
It's simple. Once outage data is in the standard, turn it into a GIS service. That's it! The beauty is, now outage data is in a common format and machine readable, which can be shared with any preapproved subscribing application; GIS; or through collaborative GIS tools, like the ArcGIS Enterprise or ArcGIS Online.
How This Helps in Making the Three Decisions
This data, along with real-time weather forecast, the external impacts, and network vulnerability provides situational awareness — what's going on right now. That forms a repeatable methodology for making those tough decisions. It helps them to decide if they need mutual aid crews. It provides the roadmap for how many and where to deploy them.
The idea of ODI is to create a community of people looking at the same data. This is not limited to electric companies. Others can provide input into the best approach that goes beyond the narrow confines of the individual utility boundary. These could include vendors, industry groups, regulators, and even think tanks.
ODI allows people like Bob to better predict the devastation (or minimal impact) of an approaching storm. They can identify what resources are likely to be available. They will be able to get a better sense of what and where damage is likely to occur to their network based on the advanced work of establishing external impacts and network vulnerability. This will lead them to stage crews and material into those areas most likely to sustain the most damage. Finally, the ODI provides utilities with information that would otherwise be very difficult to consume within their own infrastructure. With ODI and historical data combined, they can feel confident that their decisions are based on solid evidence. Bob would be proud.
Find more information on how GIS can help answer the three questions.
About the Author
Bill Meehan
Bill Meehan, P.E., heads the worldwide utility industry solutions practice for Esri. Author of Enhancing Electric Utility Performance with GIS; Modeling Electric Distribution Performance with GIS; Empowering Electric and Gas Utilities; Power System Analysis by Digital Computer, and numerous papers and articles. Bill has lectured extensively and taught courses at Northeastern University and the University of Massachusetts. Bill is a registered professional engineer.

