Understanding PV Trends Through EIA’s Net Metering EIA-826 Form
It is exciting, for those of us who have been analyzing net metering via the Energy Information Administration’s annual EIA 826 forms for years, to see the new “Third Party Owner” or TPO data EIA has added in its most recent installment.
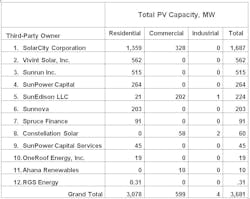
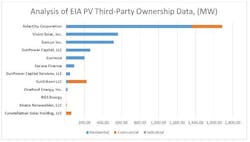
While EIA categorizes the December 2016 update’s data as “Preliminary,” it is valuable to dice the data, to see how the big players in residential PV size up.
There are only a dozen such TPOs involved in the 1200 data points across the various monthly, state-by-state results reported by EIA. And Pareto’s Law, a.k.a. the proverbial “80/20 rule” is in full swing, with fully 75% (2.8 GW) of the total 3.7 GW of PV capacity of TPO’s coming from the top 3 players (SolarCity, Vivint Solar and Sunrun).
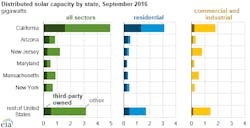
[Editor’s note: Below, the original EIA release has a helpful state-by-state chart, along with additional background on the context in which the 3.7 GW of TPO PV capacity fits. The original EIA release and EIA’s links to their underlying data can be found at this link.]
Distributed solar capacity in the United States, which includes all solar power capacity other than utility-scale installations 1 MW or larger, totaled 12.3 GW as of September. About 30% of that amount (3.7 GW) was owned by TPOs. TPOs are private companies that provide either solar electricity or equipment to generate it to building owners or tenants, typically with little or no upfront costs.
There are three primary distributed solar ownership options: self-financing, utility/public financing and TPO. EIA recently included TPOs on its monthly and annual surveys of utility operations to help capture ownership trends across states. TPOs commonly enter into either power purchase agreements or solar leases. In EIA’s reporting, TPOs are defined as energy service providers, independent of how the payments are structured.
TPOs tend to be more common in the residential sector than in the commercial and industrial (C&I) sectors. TPOs own 44% of distributed solar capacity in the residential sector, compared with 11% in the C&I sectors. The residential sector accounts for 56% of distributed solar capacity but 84% of TPO solar capacity.
California has the highest distributed solar capacity at 4.9 GW. Of that amount, about one third is owned by third parties. Arizona and Maryland have the highest shares of TPO capacity, and third parties own slightly more than half of their distributed solar capacity. Utilities did not report any TPO capacity in 20 states, all which have relatively low distributed solar capacity (about 0.3 GW total). Some states have (or had) laws restricting TPOs. Principal EIA contributors: David Darling, Cara Marcy
About the Author
Peter Arvan Manos
Utility Industry Analyst
Peter Manos is Director of Research for Electric Power & Smart Grid, on the Energy Sector team at ARC. He analyzes the latest trends across People, Process, and Technology to uncover business and digital transformation best practices for electric, gas, and water utilities. He can be reached at [email protected]


