Eversource Studies Impact of Clouds on PV Circuits

Eversource Energy Inc, New England's largest energy delivery company, serves approximately 3.7 million electric and natural gas customers in Connecticut, Massachusetts, and New Hampshire, including the greater Boston region. The investor-owned utility was an early adopter of photovoltaics (PV). As of June 2020, Eversource owned and operated nearly 70 MW of PV power interconnected with its network. Eversource also has customer-owned PV connected to the network not included in that amount.

In October 2019, Eversource approached Worcester Polytechnic Institute (WPI) with their ongoing concern — fluctuations in PV voltage generation because of varying weather patterns. These flicker events from even the most advanced PV systems could have an adverse impact on traditional voltage-controlled devices, while also impacting the ability to accurately forecast short-term generation capacity. This article reports on the study — how the research team approached the intermittent weather problem and was ultimately successful in assessing the impact that a passing cloud cover had on the electric grid, in order to optimize system upgrades.
Modeling clouds
In the past, several studies have modeled clouds and performed simulations of the impact of moving clouds upon PV systems. In the research study presented here, WPI researchers and Eversource Energy engineers follow a similar approach as taken by Kaveh Rahimi and his colleagues at Virginia Polytechnic Institute.
We developed a cloud motion simulator (CMS) model similar to that presented in Kaveh Rahimi's 'Computation of Voltage Flicker With Cloud Motion Simulator', and we integrated this model into the Synergi platform — an electrical simulation software used by Eversource Energy to analyze power distribution systems. The CMS model provides an easy interface to calculate short-term flicker values (Pst) based on the IEEE 1453-2015 standard, using global horizontal irradiance (GHI) data and measures the impact of moving clouds upon the Pst values. Running the CMS model will result in generating plots containing information related to important parameters such as voltage fluctuation, probability of instantaneous flicker sensation exceeding a specific level because of change in irradiance or line power quality, and so forth.
This information will enable planning engineers to take preventive measures, reduce strain on the grid, and avoid voltage fluctuations. It will lower the operating cycles of corrective maintenance, thereby reducing operating costs. It will also allow planning engineers to make informed decisions about new distributed energy resources (DERs) entering the grid and the subsequent maintenance or upgrades that would be necessary to support these DERs. Additionally, this information will be critical to determining spatial distribution and sizing of PV arrays in order to ensure optimal grid integration and operation.
CMS model
"The primary goal of this research project is to design, develop, and integrate the CMS model into Synergi's platform and compute Pst values without having to use any third-party software," said Eversource Director of Distribution Engineering Umair Zia.
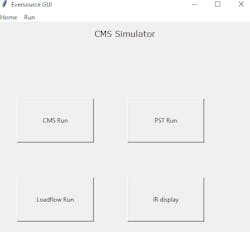
To run the CMS model on Synergi's platform, we designed a Python-scripted graphical user interface (GUI), as shown in Fig. 1, to provide the grid operator an easy interface and extrapolate impacts of cloud motion upon circuits with PV penetration. In this study, we used IR data obtained from a pyranometer installed at Eversource Energy's solar site in E. Springfield, Massachusetts. Using IR data, the CMS model offers four functionalities discussed later in the article.
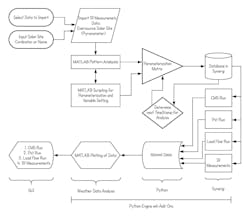
The functional block diagram of the CMS model as shown in Fig. 2 explains the steps involved in the process.
Firstly, the planning engineer is prompted to select the site ID (or name) and data to import.
Secondly, data is imported into MATLAB which runs through multiple MATLAB scripts with pre-selected variable settings to calculate Pst values, percentage voltage change, and other statistical values. Furthermore, a matrix parameterization method for determining CMS parameters such as cloud width, coverage time, and so forth is performed and values are stored in Synergi’s database.
Following this step, the stored values are fed into MATLAB again to create plots, such as Pst versus IR and Pst versus time, to extract useful information.
Lastly, hitting individual buttons, as displayed on the GUI, will populate these plots in separate windows, making it convenient for the grid operator to analyze the data.
Basic functions of the CMS model
a. CMS Run
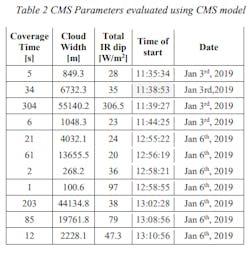
The six CMS parameters shown in Table 1 are determined by analyzing IR data and computing measurable parameters regarding a cloud's impact upon the system.
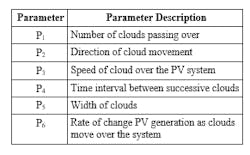
P1: The first parameter is the number of clouds passing over the PV array, that is, the number of instances the IR dropped to a lower value resulting in voltage fluctuation.
P2: The direction of the moving cloud can be determined with knowledge of the PV array's layout. The direction of cloud movement allows the simulation to adjust PV output based on the configuration and orientation of the PV array. For ease of implementation, in this study we assumed the direction of the clouds to be laterally over the array, covering more and more each second until it leaves.
P3: For cloud-speed estimation, the speed of the clouds was kept at a constant 7.6605 miles per hour, an average wind speed obtained from National Weather Service for the solar site location in E. Springfield, Massachusetts. The wind speed indicates how fast the cloud moves over the PV array and determines how long the simulation performs the analysis of one cloud over the array.
P4: The time interval between successive clouds is the time between when the IR value recovers from a cloud cover and the IR values going down because of the next cloud cover. This indicates how cloudy the day is, with a shorter interval indicating more tightly packed clouds.
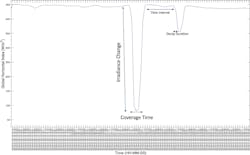
P5: The cloud width parameter determines how much of the PV array is covered as the cloud passes over. To estimate cloud width, average wind speed plus coverage time is used. Width of the clouds can be estimated by timing the average wind speed by the coverage time.
P6: This CMS parameter is a measure of how fast a PV system can react to cloud coverage. A cloud may completely pass over an array but still affect system output afterward, based on the system's rate of change.
b. Short-term flicker voltage (Pst) run — calculations
Pst values are calculated using MATLAB to determine the flicker perceptibility of a distribution system. This has two elements — long- and short-term flicker. The short-term flicker is more applicable in this case because of the impact that clouds can have in an instant over a PV array. Because of the infrastructure that was present at the time, the resolution of the IR data that was available was at a 15-minute interval only. For this reason, Pst calculations were determined for a 15-minute window instead of the normal 10-minute window. These values can be calculated using the following equations:
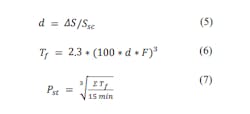
d is a parameter that describes percentage voltage flicker, 𝛥𝑆 is the change in power output, and Ssc is the maximum available fault current. These parameters are available from load flow analysis. F is a parameter that describes the fastest rate of change in the system and is set to 0.2 in this case. Tf, flicker time, calculates the flicker severity caused by a single-step voltage change. Flicker severity is evaluated as the cubic root of the sum of the flicker times within a given interval divided by the duration of the interval, which is 15 minutes. Using these equations, the data analyzed over the course of three days yields a graph of Pst over time.
Simulation results and discussion
We integrated the CMS model as an add-on feature to the existing Synergi platform used by Eversource Energy to analyze power distribution networks. A planning engineer at Eversource Energy can execute the model by hitting run on the toolbar. This will open-up a GUI, as shown in Fig. 1, with four buttons. Additionally, a command window will appear on the screen prompting for the desired wind speed to calculate cloud coverage and cloud width.
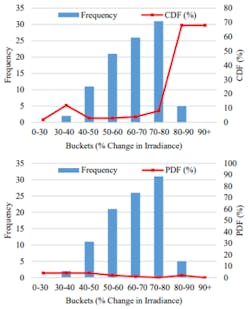
The first button runs a normal CMS calculation that generates two plots as shown in Fig. 4. From the CDF and PDF plots, valuable information can be obtained. For example, Fig. 4(a) shows that for the IR data received, 70% of the time, the percentage change in IR is less than 90%, and roughly 52% of the time, the percentage change in IR is less than 60%, indicating a cloudy weather day. Similarly, the red line in Fig. 4(b) indicates the probability that the instantaneous flicker sensation exceeds ±2% level is very low (<4%). PDFs and CDFs can be performed for other parameters in the same manner and grid operators can use the desired parameters, based upon the most probable case or the worst-case scenario.
Upon hitting the second button, Pst run, Pst values are calculated using the above mentioned equations and multiple plots are generated in separate windows. A collage of these plots can be seen in Fig. 5 below. For better understanding of the data, we created plots using 15-minute interval IR data for three consecutive days. Fig. 5(a) shows output line power compared with IR along an average day. There is a noticeable increase in the amount of line power as solar IR increases during the day. However, we also notice that line power is offset from IR slightly. This is because of how closely IR and line power follow each other.
Fig. 5(b) and Fig. 5(c) provide an understanding of the relationship between the line voltage and IR, and the impact that a cloud coverage has upon the output and utility transmission line voltages. The effect of IR on line voltage can be determined by the line power. As the current is kept constant, so fluctuations in line voltages result from a change in line power. As evident from the zoomed-in plot, there is, in fact, a lag in line voltage fluctuation because of IR.
Unfortunately, with the limited resolution of data available, this time lag cannot be accurately determined.
Also, it is important to note in Fig. 5(a), at around 12:45 p.m., there is a small dip in the IR data but there is a significant increase in line power during that time. We believe that PV systems may have moments of increased efficiency because of a silver lining effect, which happens when solar IR passes over the edge of a cloud, intensifying the sunbeam. This, in turn, causes the PV system to experience a temporary boost in performance and line power.
The Pst values were also compared against IR in order to evaluate the relationship between the two as shown in Fig. 5(d) and Fig. 5(e).
As exemplified in the beginning of the zoomed-in plot, the lobes of the IR and Pst fluctuation spike match. These plots explain the relationship between solar IR and both voltage flicker and line voltage. Fig. 5(f) reveals Pst values falling below the 2% fluctuation benchmark that Eversource Energy holds standard.
The evaluation of the Pst values in dependency upon the relative change in line voltage is presented in Fig. 5(g), revealing within acceptable range flicker values even at voltages higher than 100% of the nominal line voltage. It's evident from the plot that the highest change in Pst values (0.1% to 0.8%) occurs during the daytime between 12 p.m. and 3 p.m. and that leads to percentage change in the voltage to negative values of 0.3 and 1%. This also explains that the line power quality is within the standards held by Eversource Energy.
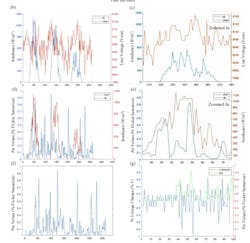
Although for ease of implementation, we assumed the direction of the cloud motion to be laterally over the array, covering more and more each second until it leaves, not considered an ideal situation, we believe that the cloud motion direction directly impacts Pst values. The Pst graphs, specifically Fig. 5(f), reveals that the direction of cloud motion can instantly change the maximum value of Pst. The change is because of the fact that for different cloud motion directions, different PV generators are affected in the time sequence, and this results in voltage fluctuation, and consequently, fluctuating Pst values. This provides for evidence that the PV installed capacities that are distributed over a wider area and connected into one integration point have the potential to effectively mitigate cloud variability and generate more stable, persistent, and more predictable power production patterns, as well as less fluctuating Pst values.
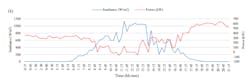
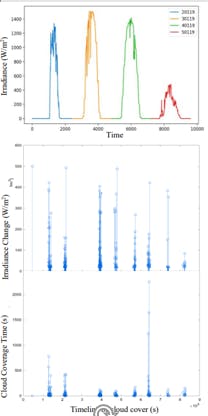
The third button, load flow run, runs a load flow within Synergi to calculate the different loads at a given time. Upon hitting the button, a new window will pop up, displaying the total meter count, total feeder count, and distribution load on the distribution network. Finally, the IR display button shows the three graphs as seen in Fig. 6. This function allows for analyzing IR versus time data for multiple solar sites at the same time. This information is useful for providing necessary backup to prevent power loss and make sure the energy demand is always met.
For example, Fig. 6(a) shows that the solar site 50119 (in red) is having cloudy weather and that there will be a significant drop in PV generation. Fig. 6(b) and Fig. 6(c) show coverage time and percentage change in IR values over longer periods of time. It is evident that there are periods when coverage times are low, but percentage change in IR is high. The two graphs further provide evidence that the change in IR depends upon factors such as time interval, cloud speed, thickness, direction of cloud motion, and cloud width.
Going forward
The proposed CMS model will offer Eversource Energy with great possibilities to measure the impact of cloud motion upon circuits with PV penetration. With the additional input of cloud speed, coverage time and cloud width are computed, providing better understanding of what happens when a cloud rolls over a PV system. Table 2 below lists computed CMS parameters.

Conclusion
The ability to predict the impact of clouds passing over a PV array, the most likely cause of flicker, and its ability to influence the power grid, is of great interest to the utility sector. This article talks about designing, developing, and integrating a CMS model into a Synergi platform. The model will allow planning engineers at Eversource Energy to calculate short-term flicker values (Pst), based on the IEEE 1453-2015 standard, and measure the impact of cloud motion upon PV systems, voltage fluctuation, and the probability of instantaneous flicker sensation exceeding a ±2% fluctuation benchmark, which Eversource Energy holds standard, because of change in irradiance. It also evaluates the impact of high PV penetration upon the performance of the electrical grid. The full report delivered in May is available at the WPI electronic archive here.
The effect of cloud cover is immediate with a drop in solar IR and hence in line power for a short time. The direction of motion of the clouds can often affect voltage changes and Pst values. In the future, we intend to adjust transformer output based on high resolution (1s) IR data in real time.
"The purpose of this research was for us to better understand and therefore plan our system to maximize the amount of PV on the system," said Eversource's Umair Zia. "More conclusions can be drawn as this model is used for longer periods of time, but the ability of the model to predict output power of a PV system and resulting voltage flicker will help us to proactively take preventive measures and appropriate levels of grid upgrades, allowing for optimum levels of PV integration."
Acknowledgement
The authors gratefully acknowledge Kaveh Rahimi and Robert Broadwater of Virginia Polytechnic Institute for sharing their work on the CMS. This research would not have been possible without the support of the Eversource Energy team, including Umair Zia, Everett Hall, Thaer Qunias, and Dan Lewis, who provided necessary data and tools for completion of this project.
About the Author
Maqsood Ali Mughal
Maqsood Ali Mughal is an electronics engineer and is currently an assistant professor at Worcester Polytechnic Institute. His research interests revolve around investigating next-generation materials for use as solar cell materials to reduce cost and toxicity, while increasing energy conversion efficiency. He is especially interested in exploring the possibility of using these materials for aerospace, biomedical, and other applications. Mughal's professional experience lies in academics, and in the oil, telecommunication, and energy industries.
Sundari Ramabhotla
Sundari Ramabhotla is a senior IEEE member at Worcester Polytechnic Institute.
Matthew Scherrer
Matthew Scherrer is a student member, IEEE PES, Worcester Polytechnic Institute.
Christian Curll
Christian Curll is a student Member, IEEE PES, Worcester Polytechnic Institute.
Markus Zimmerman
Markus Zimmerman is a student member, IEEE PES, Worcester Polytechnic Institute.
Barry Aslanian Jr.
Barry Aslanian Jr. is a student member, IEEE PES, Worcester Polytechnic Institute.