George Weaver, president and CEO of Central Georgia Electric Membership Corp. (CGEMC), wants to improve operational efficiency of the utility’s distribution system and reduce costs. His determination turned into an intensive implementation of analytic technology for distribution analysis that improves system efficiencies.
With this charge, John Fish, COO of CGEMC, developed a creative collaboration across the organization in conjunction with multiple vendors that opened a new world of opportunities for CGEMC to interpret big data and determine actions for improving system efficiency as well as cost savings.
Problem Statement
CGEMC is a customer-owned electric distribution cooperative with 55,000 billed accounts. The 25-kV system serves a density of approximately 10 meters per mile.
Historically, to calculate a total loss amount, the cooperative measured line losses by comparing the total energy purchased for the system with the total energy sold. This calculation was made on a rolling 12-month basis at the system level; while the losses could be measured overall, no information was available as to where, when or why specific losses existed on the system.
With the installation of smart grid technologies, including the Landis+Gyr advanced metering infrastructure (AMI) and SEDC meter data management system (MDMS), a significant amount of granular data became available to CGEMC staff. The opportunity to data mine for line losses provided the ability to reduce losses and costs as well as to make informed, targeted improvements to the distribution system. The problem was how to blend data from different sources and summarize large volumes of data in such a way that CGEMC staff could interpret the information to make informed decisions.
Enter SEDC
SEDC is a developer of utility software solutions, providing applications configured to meet individual utility needs. CGEMC adopted SEDC’s ReportIQ analytics platform in 2015 and uses it to provide reports at the corporate level, including financial and engineering systems.
In the fall of 2016, CGEMC and SEDC began a joint-development project to use the varied data sources the utility was collecting for line losses and create an environment where the data could be easily accessible. By February 2017, SEDC developed the prototype software that analyzed and presented line-loss data across the cooperative’s system. This model would collect, reformat, time sync and blend data from many siloed sources — including from accounting (SEDC), the Futura geographic information system (GIS), the Survalent supervisory control and data acquisition (SCADA) system, the Landis+Gyr AMI and the Milsoft outage management system (OMS) servers — and display it over an intuitive, interactive platform through SEDC’s ReportIQ dashboard.
The Model
CGEMC’s distribution system is split into 221 sections, called load zones. Each load zone contains approximately 300 endpoints over three phases of a circuit section. In ReportIQ, each load zone can be viewed and analyzed for line losses, either individually or in groups. Additionally, each phase can be analyzed separately, enabling granular analysis of a single phase containing approximately 100 endpoints on a 15-minute basis — a big step from the normal systemwide monthly data analysis of more than 5000 miles (8047 km) of line.
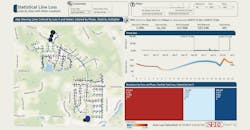
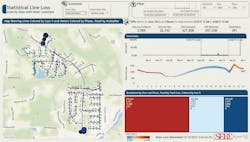
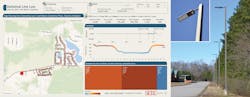
For the best comprehension, the line-loss analysis of each phase of a load zone is presented in multiple ways: tree charts that list the net kilowatt-hour loss and the percentage load loss by phase; maps that visually represent lines, endpoints and loss information; and time series that identify losses at specific points in each day. This variety of data presentation was customized by CGEMC staff.
While system data is provided on a 15-minute interval basis, SEDC found that processing 24 hours at a time was more efficient and enabled consistently faster access to the analysis while maintaining best security practices. Additionally, line-loss impact is determined over time and trends in information, so reloading of the latest 15-minute data is not necessarily beneficial to establishing trends.
Loading a day’s worth of data is quick, and ReportIQ can present the processed data over intervals of anywhere from 15 minutes to several months. The model is moving out of the development phase and into full application, ultimately to provide appropriate access to the engineering, billing and field service departments. These departments can gain strategic information from the model to make corrective steps to the system within their respective functional areas.
The Technology
This is a cutting-edge, comprehensive analytics model. For the first time, data is being shared across the various systems of the utility, enabling CGEMC staff to gain new insights from the data through an interactive user experience. This line-loss model solves a long-defined industry problem, as the lack of available technology and granular data have been the limiting factors. With the availability of big data from CGEMC’s different systems, SEDC has created a model to blend the data for CGEMC staff to interpret and use it effectively.
First, the model collects and processes large volumes of data from different sources that deliver data files at varying regularities. A series of data pipeline software scripts were written to pull in data from the AMI, SCADA, GIS, OMS, MDM and financial servers. Currently, the model receives more than 80,000 SCADA rows per day from 140 nodes. More nodes are coming on-line as CGEMC continues its AMI implementation. The AMI provides 250,000 rows of data per month across multiple channels, or more than 2 billion data points per year.
Second, no software service has been able to provide the blending and presentation capability of this CGEMC line-loss model. SEDC’s ReportIQ analytics platform blends the data for ease of use, which includes time-syncing, reformatting and marrying data that has never been integrated before. The analytics platform eliminates the guesswork and time needed to manually manipulate data and ties together multiple data streams so CGEMC can clearly understand the state of the system.
Because of its history of intensive system improvements, the cooperative currently maintains an average systemwide line-loss factor of 3.5%. With the new line-loss model, system improvements are expected to provide another 1% drop in reported losses, which translates to US$700,000 to $800,000 in annual savings. These savings estimates are considered conservative. Not only do these savings pay for the model development within a few months, but the improvements can pay for more projects that show incremental efficiencies and still reduce upward pressure on retail rates.
SEDC developed a presentation of data in which CGEMC can perform discovery steps across the multiple enterprise systems. These steps include exploring the data to spur questions, identifying patterns and trends, and enabling staff to act on information to make swift, informed decisions for the cooperative. CGEMC staff can now mine the data, understand any unmetered power and make decisions about addressing the loss.
Use Cases
The current output of the collected data is proven to be highly granular and accurate. For example, specific circuits contain known amounts of unmetered load for streetlighting and stoplights. Currently, lighting load is not included in the model, but noticeable losses during night hours correlate to the anticipated lighting load. The ability to identify missing streetlights on a load zone proves the accuracy of the model. A next step, incorporating lighting load, will provide CGEMC with greater accuracy in determining true line losses during night hours.
Another useful aspect of the model is the various ways data is presented within the ReportIQ dashboard. While it may be important to know the percentage loss occurring on a phase or circuit over a period of time, it may be just as important to know the raw loss of that phase or circuit. ReportIQ presents the data in these and other ways.
For example, if one phase shows 30% loss, but the raw loss is only 100 kWh, it becomes a low-priority concern or could be explained by normal equipment limitations. However, if a phase shows 4% loss, but the raw loss is 75,000 kWh, then engineering and field teams might be alerted to a more urgent situation. CGEMC staff would allocate the proper resources to remedy the issue, as appropriate.
In addition to these scenarios, CGEMC has identified several other use cases to improve its system using the model:
• Load balancing. The use of data analytics is changing CGEMC’s approach to load balancing. Traditionally, the cooperative uses snapshots of amperage readings at peak times to decide when to shift load from one phase to another. Now using energy data at the load zone is expected to be a more effective way of balancing the feeders. Summer 2017 was the first summer season energy data was collected and analyzed within the line-loss model.
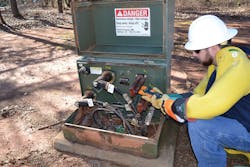
• Metering error detections. The data available in the line-loss model has led CGEMC staff to suspect a possible metering multiplier problem. For example, a location that should have a multiplier of 80 but is identified as a multiplier of one would cause AMI data to be misstated with significant losses of energy flowing to that location. The correction to this error involves updating the enterprise documentation such that it accurately reflects the actual hardware on the system.
Another example includes reviewing the GIS information for meter accuracy. There may be meters labeled incorrectly within the GIS as A-phase when they really are C-phase. Or, energy registers on reclosers are labeled backward, in that the recloser panel is labeled as A-phase but really is C-phase. While the instance of these errors is small, this refining process reconciles various information sources to each other.
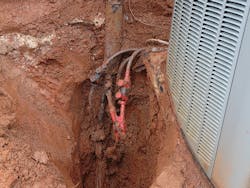
• Power diversion. This is defined as theft of electric power in which current is diverted to bypass the meter or any type of tampering to obtain unmetered service. As CGEMC evaluates where system energy is delivered, certain load zones indicate power diversion may be occurring by a single phase with unusually high losses over a long period of time. Armed with this information, CGEMC can send a field team to investigate the area of a specific load zone phase — about 100 metered sites — to determine whether power diversion is in fact occurring.
This is a vast improvement from decision making without ReportIQ, in which CGEMC would incur more costs to have an investigative department search for instances of power diversion over the entire 55,000 endpoint system. With ReportIQ, the haystack shrinks from 55,000 endpoints to approximately 100, and CGEMC has a reasonable expectation of a payback for these targeted efforts. This represents a small but significant contribution to cost savings because of increased revenues in locating non-metered load and lowered expenses in sending crews to a specific area instead of the entire system.
• Capacitor placement optimization. From an operations perspective, knowing the energy load data of the system at any 15-minute interval means the operations engineer understands precisely where and when energy congestion is occurring. Engineers can make informed decisions about where best to place, move or replace capacitors on the system. Thus, energy distribution efficiencies will increase, equipment will be better addressed for longevity, and money set aside for system improvements will be more effectively spent and saved.
• Other uses. The line-loss model is CGEMC’s most ambitious analytics project and future applications are unlimited. This project is driven first because of the significant potential savings impact for the organization, but there are other applications and benefits that will come from using all the data in a blended, intelligent way. Some future goals include setting real-time alerts when data signatures are present, performing machine-based learning and examining transformer loading.
Data Focus
Utilities collect big data from different sources but do not realize its potential use. While each server has its own data that can provide certain levels of insight, something more is necessary to blend the data together and obtain a bigger picture with greater detail. Possibilities exist to apply the framework and lessons learned from this SEDC ReportIQ line-loss analysis to other analytical problems in the electrical utility space.
CGEMC has become a data-driven organization through its partnership with SEDC to create a superior and flexible energy-flow model. The significant dollars saved prove the utility is going down the best road for its customer-owners. ♦
Herschel Arant is the senior vice president of engineering and power supply with Central Georgia EMC. He holds BSEE and MSEE degrees from Georgia Tech and an MBA from Georgia State University. He is a member of IEEE and a registered professional engineer.
Check out the March 2018 issue for more articles, news and commentary.
About the Author
Herschel Arant
Herschel Arant is the senior vice president of engineering and power supply with Central Georgia EMC, where he has worked for the past 13 years. Arant has more than 20 years of experience in the area of T&D engineering and system operations. He holds BSEE and MSEE degrees from Georgia Tech and an MBA from Georgia State University. He is a member of IEEE and a registered professional engineer.