Demand Flexibility: Harnessing Behind-the-Meter DERs to Build a Virtual Power Plant
In our last article, we described the tools now available to move from limited and siloed utility programs for energy efficiency, demand response, and storage to reliable, integrated and scalable demand flexibility markets. Smart meter data and open source analytical methods provide the building blocks to replace deemed savings estimates and delayed evaluations with transparent, timely, and direct measurement of hourly load impact at the meter to enable the necessary telemetry to make behind-the-meter interventions legitimate grid resources.
But beyond simply modernizing the measurement of isolated efficiency and demand response programs, direct measurement of resource curves — the metered change in demand on an hourly and locational basis — can enable the integration of demand side interventions to achieve more comprehensive and cost-competitive demand flexibility resources.
Procure Demand Flexibility as a Virtual Power Plant
The change in the shape of demand behind-the-meter, regardless of what drove the change, is known as the resource curve. By targeting the right classes of buildings and project types, whether residential or commercial, HVAC or lighting, the effects are measurable and, in a portfolio, predictable and consistent.
When combined with the unique signature of a transmission and distribution (T&D) constraint, it becomes possible to deploy virtual power plants consisting of aggregated behind-the-meter demand flexibility resources that maximize the value to the grid and the customer.
The following examples show how targeting the right types of customers and interventions can maximize grid outcomes and be treated like a true resource.
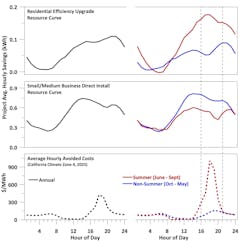
The middle and top panels of Figure 1 show Recurve’s measurement of the seasonal resource curves of two recent California energy efficiency programs. These measurements are carried out with the CalTRACK 2.0 hourly methods implemented by the open-source OpenEEmeter. The bottom panel gives the average marginal utility avoided cost by hour for those same periods determined by the California Public Utilities Commission’s (CPUC) 2019 Avoided Cost Calculator. The vertical dashed lines represent the 4 p.m. to 9 p.m. summer peak period where capacity, T&D costs spike, making resource adequacy much more costly.
Figure 1 shows that the residential energy efficiency program (top), which consisted of HVAC maintenance, lighting, and smart thermostat measures, along with customer engagement and education, delivered the greatest demand reduction during peak hours, especially during hot summer months. In comparison, the small/medium business direct install program (middle), consisting largely of lighting and refrigeration measures, delivered a daytime-peaking resource curve, along with continual baseload (24x7) savings.
As described in Part 1 of this series, as solar generation reaches higher levels of saturation, mid-day savings increasingly overlap with periods of overgeneration events and renewables curtailment. This is reflected in the hourly avoided cost profile (bottom panel of Figure 1), which essentially disappears during the midday hours of 9 a.m. to 4 p.m. for all but the summer months. In contrast, the summer peak period exhibits a spike in marginal costs that stems from high capacity and T&D.
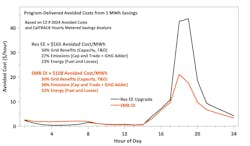
With a metered resource curve that peaks in coincidence with these high summer evening marginal costs, the residential efficiency program yields far greater value on a per-megawatt hour basis than the small/medium business direct install program. This can be seen in Figure 2, which shows how avoided costs accrue by hour for 1 MWh of savings for both of these programs.
Because the residential program delivers a high fraction of savings during the summer peak hours, 1 MWh equates to US$165 in avoided costs, compared with US$108 for the small/medium business direct install program. The latter delivers 35% of its savings between 8 a.m. and 3 p.m., yet these savings yield only 6% of the program’s total avoided costs. In contrast, despite only 7% of program savings occurring during the summer peak hours, those savings account for 37% of avoided costs.
Two conclusions are immediately apparent from this analysis.
First, whatever is done to a building creates a resource curve defined by the impact relative to the hour of the day. There are very few efficiency measures that deliver flat savings profiles, but that is often how efficiency is treated in utility load forecasting models (with the exception of some accounting for seasonal and on/off-peak variations).
Second, not all efficiency savings are created equal.
In this case, a high fraction of the residential program’s savings occur during the summer evening peak period when people are home and using air conditioning, while the small/medium business direct install program is driving baseload and mid-day savings. When combined with California’s avoided cost data, it is clear that there are very real differences in the value of these resources.
In other words, demand side programs that save more energy during peak times (by reducing weather-related heating and cooling needs, for example) have much greater value.
These examples show how two different efficiency programs are driving very different grid values because of the temporal differences of their load impacts. But the benefit of measuring metered resource curves goes far beyond just quantifying existing programs. For demand flexibility to be competitive in utility-scale resource procurement and solve specific grid problems, we must move beyond expensive and siloed efficiency programs to more integrated customer-facing solutions that are focused on grid value.
By directly metering the 8760 (24 x 365 = 8760, a.k.a every hour of the year) change in demand, regardless of the intervention, we can now simultaneously gauge the full impact of efficiency, demand response, load shifting, and other strategies, instead of getting wrapped around the axel trying to attribute specific value and setting goals for each independently.
By integrating resource curves that can be broken into dispatchable event-driven changes (energy) or predictable long-term effects (capacity) into a performance-based approach with more granular avoided cost information based on the full stack of grid values, utilities can reward implementers for metered results and integrated demand flexibility can serve as a procurable, market-based, long-term resource that solves time- and location-specific grid problems.
To this point we’ve described how transparent, consensus meter-based modeling methods (CalTRACK) and open-source implementation of these methods can create a foundation for treating demand flexibility like a procurable, reliable, supply-side resource (Part 1). In this installment, we’ve shown how applying these methods yield resource curves that can be valued directly using marginal hourly utility avoided cost data and enable demand side resource integration.
In the next installment, we will explore real-world case studies of how to make metered pay-for-performance (P4P) demand flexibility programs more reliable and cost-competitive, by aggregating portfolios and using advanced metering infrastructure (AMI) data analytics to identify and recruit customers with a high potential to deliver the most valuable load impact for a given intervention.
We will also explore how aggregated behind-the-meter demand flexibility virtual power plants can be deployed through markets and “flexibility purchase agreements” that can be financed like grid infrastructure investments.
For Part I, see here.
About the Author
Matt Golden
Matt Golden is CEO of Recurve, which provides platforms that measure demand flexibility to utilities and aggregators, based on the open-source OpenEEmeter. He also led the Investor Confidence Project at Green Building Certification Inc. (GBCI) and was previously the founder of an energy-auditing software startup and retrofit contractor, which was also called Recurve.
Adam Scheer
Adam Scheer is director of customer solutions at Recurve. He previously worked on energy efficiency programs and energy policy at Pacific Gas & Electric (PG&E). He has a PhD in physics from the University of Colorado-Boulder and has completed a postdoctoral fellowship at Sandia National Labs.
Carmen Best
Carmen Best is director of policy and emerging markets at Recurve. She previously was head of EM&V for the California Public Utilities Commission (CPUC). She has a master’s degree in resource management and energy policy from the University of Wisconsin-Madison and a bachelor’s degree in geology from the University of North Dakota.


