A decade ago, experts were encouraging utility executives to realign their vegetation management programs with measurable reliability benefits. It was suggested this realignment would result in lower costs and bring utility vegetation management (UVM) out of the industrial age and into the technological realities of modern business management. The most significant and clearest measure of reliability improvement has been with extra-high-voltage transmission, because the internationally mandated FAC-003 standard spurred utilities to achieve specific results. FAC-003 affected transmission lines, which account for about 3% of the total miles of overhead power lines in the U.S., but what about the other 97% of miles of overhead T&D electric lines in the U.S.?
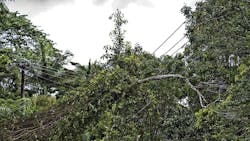
Although the bright light of business models, including economies of scale and process management, has been shined into the voids of UVM performance, there is no consensus that the industry has given birth to the golden age of utility arboriculture. Young arborists, some freshly trained on UVM, are still put to the daily task of working around lethal conductors engulfed in vegetation. Utility arborists, scolded by the public for being butchers, continue to wonder why the industry does things the way it does them. Every year, a few go to work and never return. Many more tree workers lose their lives or are injured because they made contact with electrical energy, often not knowing the wires were there.
It is worth reviewing what the industry does for reliability with regard to vegetation management and the assumptions behind it, if only to reduce the risk to human life.
Reliability-Centered UVM
Studies conducted to evaluate how UVM has conformed to reliability data revealed several interesting findings:
• Reliability-centered maintenance (RCM) applied to UVM may shift focus away from other objectives, such as safety, fires, environment and the customer.
• When UVM programs are prioritized to improve reliability metrics, long-term UVM workloads are likely to increase.
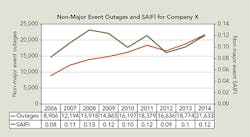
• An increase in tree-related outages can occur at the same time reliability is improving because reliability metrics are relative (see chart 1).
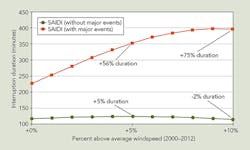
The need to apply computer-enabled technology to UVM has coincided with the adoption of IEEE 1366. The interruption cost estimate calculator designed by the U.S. Department of Energy reinforces the nexus between data-driven UVM and a burgeoning growth of reliability data. It would be imprudent to discourage actions that prevent outages that would affect large electric loads. However, it also is important to recognize the priorities of electric system reliability are not the only motivation for performing UVM.
The consequences of applying electric system reliability metrics to UVM should be fully vetted. Is it acceptable that RCM encourages UVM policies that increase the frequency of outages? Improvements for relative reliability and absolute reliability are two separate outcomes, both of which require adequate planning and resources to achieve.
Case Study of Reliability Metrics
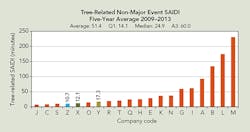
The following is a comparison study between the system average interruption frequency index (SAIFI), the system average interruption duration index (SAIDI) and tree-related outages per pole mile between three companies (X, Y and Z).
The UVM programs for these utilities represent a RCM program (utility X), a compliance-based program (utility Y) and a utility (utility Z) that had favorable reliability performance but was dissatisfied with its UVM program. All three companies were excellent performers based on SAIDI and SAIFI (see charts 2 and 3). Utility Z initiated the study with CN Utility Consulting by asking the question, “How is it possible we achieve best-in-class reliability when we know the UVM program is not meeting best management practices?”
By comparing the metrics from the three companies within a field of other companies, CN Utility Consulting found several revealing facts that demonstrated the limitations of using reliability metrics as a measure for the standard of care for UVM.
Utility X almost doubled the number of tree-related outages on its distribution system in five years (2008–2012) and still showed significant improvements in SAIFI (31%) for the same years (see chart 1). By focusing UVM efforts on high-customer-density feeder lines while deferring maintenance on single-phase lines with lower customer density, X was able to report almost best-in-class metrics in 2012. An increase in SAIFI in 2011 could have been an anomalous year given the return to dropping SAIFI values in 2012. Subsequent years, 2013 and 2014, suggest something else is happening. Potentially, there is an upper limit of tree-related outages at which point SAIFI also will increase.
Another interesting aspect of the reliability metrics occurs when SAIFI increases faster than SAIDI: The customer average interruption duration index (CAIDI) actually improves in spite of overall worsening of the other metrics. This is another example of how reliability metrics might be misleading. A utility could show exemplary reliability — in comparison to industry averages — by only focusing on non-major events, even while vegetation-related SAIDI, SAIFI and outages are increasing.
Outstanding reliability is a product of interpreting statistics and focusing on the bigger picture of utility reliability, which includes other failure modes such as equipment failures and generic categories such as non-major weather events. If asset improvements are made — such as replacing equipment, adding isolating fuses, monitoring with sensors and making equipment more resistant to weather, vegetation and animals — then reliability will improve and vegetation appears to be under better control. In reality, it is the asset that is improved not the vegetation management.
In a comparison of reliability indices for the three utilities of interest (X, Y and Z), they all show excellent metrics when compared with the UVM industry in general. If the charts only included peer utilities (with similar key characteristics), all three utilities are best in class among their comparators. These two charts also show X and Z, the utilities with an RCM program, compare well with Y, the utility with a compliance-based program. Of note, a majority of the other utilities in the first quartile have cycle-mandated programs (regulatory-based programs).
As previously noted, utility X is able to achieve high-reliability performance as measured by SAIFI while the absolute number of outages has increased 143% over a nine-year period. Utility Z knew there was something misleading about its best-in-class tree-related reliability metrics, because the increases in the percent of trees in contact with power lines and the increases in the percent of reactive maintenance were not represented by these measurements.
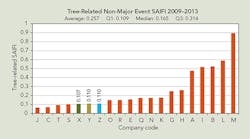
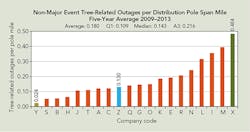
What was unclear to Utility Z was the relative value of SAIFI and SAIDI. In other words, IEEE metrics are customer-density dependent and UVM is tree-density dependent. When comparing utilities X, Y and Z with peers using an absolute rate (outages per mile), a different picture emerges (see chart 4). Utility Y, which is focused on regulatory mandates, achieves similar SAIFI/SAIDI but a much better outage prevention performance than the RCM utility, X, while meeting other objectives as well. These objectives include public and worker safety, fire risk reduction and environmental quality, which results in best-in-class reliability measured as an absolute rate.
UVM Objectives
Reliability is a major objective, especially as the industry enters into an era when climate changes are a significant threat to utility operations. However, effective vegetation management is not a direct response to conditions that negatively impact reliability. The reliability metrics that currently guide vegetation management do not measure or recognize the full extent of the UVM workload or forestry conditions. It is not the incremental tree growth that impacts reliability but rather the accumulative growth that leads to branch and tree failure. Nonetheless, it is still growth UVM must control to prevent interruptions. This growth component must be managed in a cost-effective way, and UVM must be performed to satisfy other objectives besides reliability.
The use of reliability metrics as a measurement of UVM efficacy is pressuring utilities to practice reliability-measured UVM rather than sustainable UVM that adheres to principles of forestry and urban arboriculture. All vegetation near power lines must be managed at some point, regardless of its impact on reliability. Delaying maintenance to serve improvements to reliability metrics compromises all of the objectives and creates a greater long-term risk. This research was performed to demonstrate the shortcomings of RCM and to offer some alternatives to steer UVM in the direction of a more balanced approach that includes multiple objectives.
William Porter is a director of consulting services at CN Utility Consulting, a company that offers UVM consulting and field services. Porter has more than 20 years of experience in the UVM industry and has led consulting projects and benchmark studies throughout the U.S. and Canada. He has focused his research on legal, program development and comparative studies.