Data-Driven Strategies to Reduce Vegetation-Related Power Outages in MSEC's Service Territory
Key Highlights
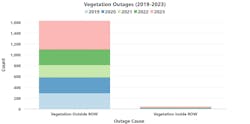
- Over 95% of vegetation outages are caused by trees outside the ROW, emphasizing the importance of managing external vegetation growth.
- LiDAR and satellite imagery provide precise data on vegetation proximity, enabling targeted and cost-effective clearance efforts.
- A GIS-based Tree Mortality Model helps prioritize hazard tree removal, reducing outages by 60% post-drought periods.
- Soil and rainfall data influence vegetation regrowth predictions, allowing for tailored trimming cycles across different substation areas.
- The analysis supports informed bidding, cycle optimization, and validation of existing vegetation management plans, leading to improved system reliability and cost savings.
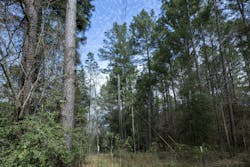
About 10% of the service territory for Midsouth Electric Cooperative (MSEC) lies within the Sam Houston National Forest. This area is predominantly characterized by Loblolly and Shortleaf Pine trees, which can attain heights exceeding 100 ft. Consequently, these trees pose challenges in maintaining a clear right-of-way (ROW) of 10 ft on either side of the conductors and preventing vegetation-related outages.
Over the years, vegetation has been the primary cause of outages at the cooperative with a service territory spanning 1600 square miles across six Texas counties. Of the vegetation-related outages, more than 95% are attributed to trees outside the ROW. This observation aligns with the findings of research conducted in most utilities, which has consistently shown that trees growing within the ROW contribute a negligible percentage of vegetation outages compared to trees outside the ROW.
Determining the Effects of Weather Conditions
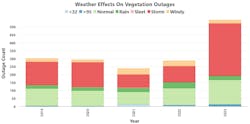
Over the last five years, most of MSEC’s vegetation outages were experienced during storms. This is consistent with research that shows that more than 80% of power outages are due to severe weather. However, it appears even in “normal” weather conditions, trees outside the ROW still cause a significant number of outages. Research has also shown that not only dead trees, but live trees contribute significantly to power outages.
Rainy and windy conditions have had an equal contribution to outages year-over-year on the MSEC system. Following a substantial rainfall, some saturated soils, especially sandy soils, lack the necessary stability to support tree roots, leading to their eventual collapse and hence more outages experienced in areas dominated by such soils.
Performing a Geospatial Analysis
In response to the significant number of post-drought vegetation-related outages, a comprehensive geospatial analysis was performed using LiDAR data, MSEC outage data, environmental data and satellite imagery. This analysis was instrumental in developing an optimal vegetation management (VM) program to update the cooperative’s current plan. The project was carried out by EMPACT Engineering, a consulting firm specializing in engineering and technology, located near MSEC’s headquarters in Navasota, Texas.
EMPACT Vegetation Insights (EVI) delineated the sections of the MSEC distribution system that required immediate ROW clearance and areas that could withstand extended trim cycles. Additionally, the MSEC service territory was also characterized based on lightning strikes, vegetation cover type and soil types. These data inputs were used in modeling tree mortality and determining optimal trim cycle lengths.
Characterizing the MSEC Territory
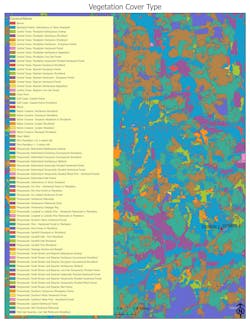
The vegetation cover type data used in the analysis is a 398 class, 10-m spatial resolution dataset developed through a collaboration of the Texas Parks and Wildlife Department (TPWD) and other partners. The dataset was developed from National Agricultural Image Program (NAIP) aerial imagery and more than 14,000 ground data points. This data is used by a wide variety of partners in Texas for conservation planning and management.
A 150-ft buffer was established around MSEC conductors to form a “utility forest.” This forested area immediately surrounding MSEC primary conductors contains tall trees that could potentially cause an outage or damage utility infrastructure.
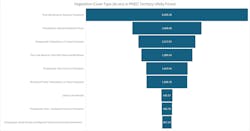
Based on the TPWD data, the top five vegetation cover types in MSEC utility forest are Post Oak Savanna (Savanna Grassland); Pineywoods (Upland Hardwood Forest); Pineywoods (Disturbance or Tame); Post Oak Savanna (Post Oak Motte); and Pineywoods (Pine Forest or Plantation).
Conducting a Soil Survey
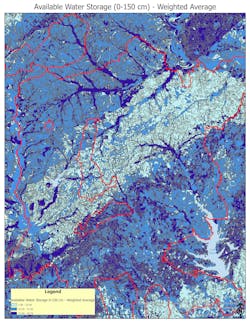
The team characterized MSEC territory’s soil using the Soil Survey Geographic Dataset (SSURGO). This digital soil survey, which is developed and distributed by the Natural Resources Conservation Service (NRSC), is currently the most detailed level of soil geographic data available. SSURGO provides information about soil characteristics, properties and suitability for various uses.
Because soil moisture is considered the single most important factor affecting plant growth, the analysis focused on the soil available water capacity (SAWC) in the top 150 cm of the soil or the root zone.
SAWC is the amount of water that a soil can store and can be accessed by plants and is expressed as inches, volume fraction (inches of water per inch of soil), or as a percentage. SAWC demonstrates the soil’s capacity to support plant growth between rainfall events and its ability to effectively buffer the root environment against periods of water scarcity. A higher SAWC is advantageous for tree survival during drought conditions.
Analyzing Rainfall
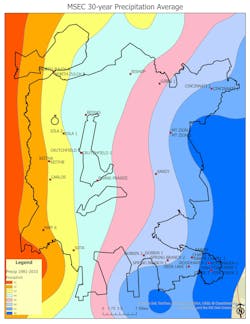
Like SSURGO, precipitation data for Texas was also obtained from the NRCS. This data was created from 1981 to 2010 rainfall averages.
MSEC territory receives 41 to 48 in. of rainfall on average. This is favorable for Loblolly and Shortleaf pines, which dominate parts of the MSEC territory in the Sam Houston National Forest.
The 7-in. rainfall gradient in MSEC territory from west to east influences vegetation growth rate. For instance, the Highway 6 Substation, located in the western region, receives 6 in. less rainfall compared to the southeastern substations such as Fish Creek and Woodhaven. Consequently, this affects the vegetation cover type as well as growth rates, which leads to a need to treat these substation areas differently when it comes to VM.
Planning Hazard Tree Control Using a Tree Mortality Model
As per ANSI 300 Part 7-2012, a hazard tree is a structurally unsound tree that poses a risk of injury to individuals or property damage if it fails. Hazard trees are a subset of danger trees, which encompass any trees that may encounter electrical supply lines.
Prolonged dry periods, as observed during the Texas droughts of 2010-2014 and 2021-2022, have resulted in an increase in tree mortality within the MSEC territory. This has subsequently led to a heightened number of hazard trees in the utility forest.
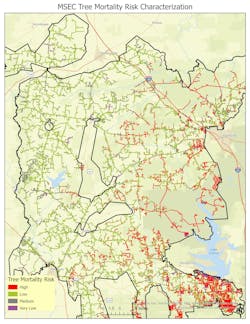
After registering record vegetation outage numbers immediately following the 2012 drought, MSEC responded by creating and employing a GIS-based Tree Mortality model. The model was developed in ArcGIS using SSURGO data, vegetation cover type, rainfall data and MSEC outage data as model input.
The intersection of low SAWC, lower rainfall and forest vegetation cover (Pines and Oaks) automatically present a greater risk of hazard trees or dead trees. The resultant map is used to dispatch and direct crews to “hot spots” instead of driving the full span of the service territory scouting for dead trees. Timely removal of hazard trees using the model helped the co-op to reduce vegetation outages by 60%.
Performing LiDAR Vegetation Analysis
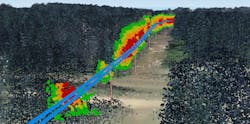
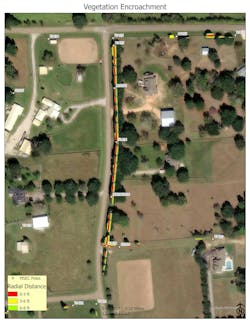
The team captured LiDAR data from early June to early July 2024 and analyzed for the whole MSEC service territory. Figure 8 is a screenshot of the current vegetation status around conductors on one of the feeders. The different colors represent distance of vegetation from the conductors based on MSEC ROW clearance practice. Red is 0-3 ft, yellow is 3-6 ft and green is 6-10 ft. MSEC maintains a 10 ft clearance between conductors and vegetation.
Armed with this actionable information (which is available for the whole system), MSEC will dispatch crews to these exact locations where vegetation has been identified to be in violation of the ROW distance.
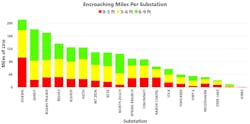
The Dobbin substation had the highest overall number of miles with vegetation within the 10 ft ROW. Furthermore, the same substation also has the highest number of miles with vegetation within 3 ft of conductors (about five times the second highest). Ideally this would be the top priority for ROW work.
Calculating the Number of Trees in the ROW
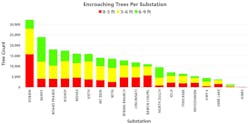
At the substation level, the team broke the analysis down to the tree level to get an estimate of the number of trees involved in each encroachment violation. Knowing the tree count helps in estimating the effort and cost needed to clear the ROW.
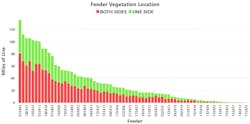
They also looked at the vegetation location around feeders. ROW companies apply a double rate to clear vegetation on lines that have vegetation encroachment on both sides of the line. Armed with this information, MSEC now has a good idea of cost estimates before ROW crews bid for the following year’s clearance work.
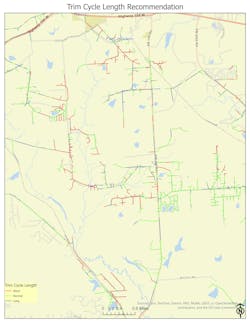
As far as trim cycle recommendations, MSEC maintains a 10 ft ROW around their distribution lines by trimming any encroaching branches and foliage. The co-op operates on a five-year trim cycle for most of its service territory.
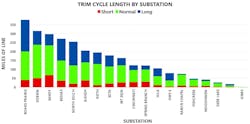
After their analysis, EMPACT Engineering recommended MSEC to maintain the current trim cycle but also to pay close attention to sections with fast-growing vegetation. The “Short” group represents areas where environmental factors promote rapid regrowth after trimming which necessities more frequent visits. The “Normal” group represents MSEC’s five-year cycle; and the “Long” group represents areas where there is mostly grassland, pastures/fields or areas with no significant tree growth. This latter group can do with even less, or in some cases, no visits at all.
The Sandy and Dobbin substations each have at least 50 miles of line in the short cycle length category, which necessitates more frequent visits than the rest. Roans Prairie, Bishop and Bedias closely follow with at least 35 miles each exposed to potential rapid vegetation re-growth.
Recommending a Feeder Trim Cycle Length
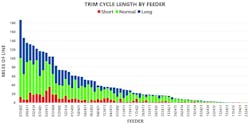
(Fig. 15). When looking at the MSEC system exposure to fast regrowth at the feeder level, Feeders 182414, 032413 and 182413 have the greatest exposure (>20 miles of line exposed) and hence require the most attention. The top three feeders are closely followed by 142403, 072401, 142402, 012404, 032414 and 122414 all with at least 15 miles of line exposed to fast re-growth.
A shorter than “normal” cycle length, preferably every two to three years is recommended for the top nine feeders and mandatory mid-cycle reviews for the rest of the feeders. Another way to look at these results is that there are cost savings wherever the feeder does have areas that do not require frequent revisits.
Looking Forward
More than 95% of MSEC vegetation-related outages are attributed to trees outside the ROW. This highlights the cooperative’s vulnerability to hazardous trees, while simultaneously demonstrating the effectiveness of its ongoing and consistent VM program. Notably, only a small percentage of vegetation outages are linked to trees growing within the ROW.
An effective VM plan must incorporate grid performance data, environmental data, vegetation data, institutional (tribal) knowledge and innovative approaches such as remote sensing (LiDAR, satellite imagery, etc.) and geospatial analytics. EVI is founded upon these fundamental methods, data and a robust collaboration with the utility. Using the EVI report, MSEC can now do the following:
Informed Bidding Process. EVI has provided MSEC with data and information that they will share with their ROW contractors during the bidding process. They can influence the process in two ways. First of all, they will have a comprehensive understanding of the vegetation intensity of their utility forest. This enables them to negotiate a more favorable price for sections of the system where there is minimal or no vegetation. Secondly, the cooperative recently discovered that ROW contractors charge double the price for sections where vegetation clearance is required on both sides of the conductors. EVI provided the cooperative with this information for every section of line where there was encroachment into the ROW.
Cycle Optimization. Knowing the characteristic of the utility forest has helped MSEC to have a good idea of regrowth rates based on the microenvironment. Rainfall gradient of 7 in. from the west to the east of the territory and different soil types with different water holding capacities influence how fast vegetation will grow. Also, the different vegetation types influence the type of growth expected.
The second way this has optimized their cycle is by moving forward feeders that need attention earlier into the cycle and vice versa. This ensures that money is spent where it needs to be spent, and attention can be given to feeders that require urgent attention and saved on feeders that do not require any immediate work.
Validation of Co-op’s Current Plan
Several years ago, MSEC developed a VM plan using GIS modeling and predominantly freely available data. This plan remained in use until EMPACT Engineering conducted an update using LiDAR and more recent datasets. This update proved beneficial for the cooperative, as it revealed that the circuits identified by EVI as those requiring the most attention were the same circuits scheduled for trimming by the cooperative this year and the following year.
This discovery validated the cooperative’s plan based on current data and analytics modeling. EVI enhanced the value proposition and optimized the cooperative’s plan by adopting a more quantitative approach. Instead of merely identifying circuits that required clearing, they now have a comprehensive understanding of the extent of clearing required, encompassing the length of the line and the number of trees in the ROW.
LiDAR vs Satellite Imagery
The question of whether LiDAR or satellite imagery is superior for UVM has been posed repeatedly. Each technology offers unique advantages. LiDAR provides survey-grade location accuracy and 3D modeling of the terrain and vegetation, while satellite imagery, particularly multispectral imagery, enables more detailed vegetation analytics, such as assessing vegetation health and identifying species. A combination of these technologies provides a comprehensive understanding of the vegetation and effectively conveys its characteristics.
As LiDAR technology becomes more affordable and efficient, it presents a favorable opportunity for utilities. LiDAR offers multiple applications, contributing to cost reductions and significantly enhancing its value proposition. In the case of MSEC, LiDAR is used not only for vegetation analytics but also for correcting their GIS with precise location data, conducting joint use audits and managing pole loading. This multifaceted application of LiDAR has made it highly valuable. EMPACT Engineering has assisted MSEC in analyzing vast point cloud data to derive actionable information, demonstrating the potential of LiDAR in this domain.
If a utility lacks access to LiDAR data or does not have capacity or capability to analyze such data, they can still freely use available datasets such as SSURGO, Precipitation and Vegetation Cover type as a foundation. MSEC serves as a notable example of this approach. They developed their initial vegetation management plan, which has demonstrated significant effectiveness, employing GIS and free data.
Their recent collaboration with EMPACT Engineering and integration of LiDAR technology into their operational processes has significantly enhanced the efficacy of their vegetation management planning. This advancement has eliminated a substantial amount of uncertainty from their entire workflow, encompassing budgeting, bidding and execution in the field.
To learn more about the budgetary savings for utilities offered by EMPACT Engineering’s EVI technology, please visit empactengineering.com/
About the Author
Comfort Manyame
Senior Manager, Research and Technical Strategy
Dr. Comfort Manyame, GISP is the Director for Geospatial R&D at EMPACT Engineering. Prior to this role, he served as the technology and research strategy lead for MidSouth Electric Cooperative in Texas for over a decade. Manyame leads EMPACT Engineering’s vegetation management research, utilizing high-resolution LiDAR and remote sensing imagery. His work has been widely published, including in Esri’s “GIS Best Practices for Municipalities, Cooperatives, & Rural Electric Utilities” and RE Magazine. Manyame holds a Ph.D. from Texas A&M University in College Station, Texas.
