In response to increasing frequency and damage of storm events and requests from customers and municipalities to improve service reliability and harden its electrical infrastructure against future storm events, Unitil developed a vegetation-centered Storm Resiliency Program (SRP). The program kicked off as a test pilot in 2012, and in 2013, became a full 10-year program. The program’s intent is to make the electric system more resilient to tree outages particularly during storm events. To accomplish this, Unitil seeks ground-to-sky clearance and intensive removal of risk trees adjacent to the critical sections of electric circuits.
The goals of the SRP are to:
- reduce tree-related incidents and resulting customer interruptions;
- reduce municipality impact along critical portions of targeted lines in minor and major events;
- reduce overall cost of storm prep and response;
- improve restoration; and
- preserve municipal critical infrastructure.
The Measurement Problem
Over the years that followed, the SRP was well accepted by customers, and Unitil’s overall storm restoration times were favorable compared to regional peers. Justifying the high cost of this work, however, became a regulatory necessity. The problem was how to quantify outages that were prevented and did not occur. The first idea to quantify the SRP impact was to provide evidence that vegetation was removed and exposure was reduced. In 2016, Unitil engaged GeoDigital, its provider for vegetation management software, to perform LiDAR (Light Detection and Ranging) capture of the SRP circuits pre- and post-pruning. Using GeoDigital’s vegetation management software and LiDAR data, Unitil was able to plan its vegetation pruning work and assess the vegetation conditions before and after pruning was complete.
The LiDAR results were useful for developing the pruning and removal plan and quantifying a reduction in exposure, but this still did not quantify the system reliability improvements and overall performance resulting from the program. The next idea was to compare the outage events on sections of circuits that underwent SRP work against sections on the same circuits that did not undergo SRP work, as well as other circuits on the system that did not have SRP work done yet. This allowed for comparative performance analysis of the SRP and non-SRP circuits based on SAIDI, CAIDI, SAIFI and other reliability metrics and ultimately, the projected reliability improvement of the system and cost savings for Unitil’s customers.
This process required assembly and analysis of a significant amount of data from Unitil’s systems such as vegetation management work data, outage management data, storm cost data and customer calls mapped spatially using the geographical information system, along with LiDAR and imagery. A tool was needed for the complex data analysis combining these sources. GeoDigital’s operational reliability intelligence partner, OBI Partners, was brought into lead the data analysis effort.
Associating SRP Work with Outage Events
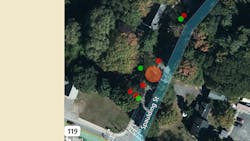
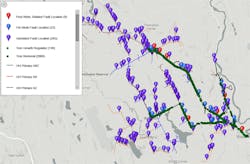
Data analysis began by correlating outage events to the SRP work activities both spatially and temporally. This identified outages that occurred where SRP work was performed, and whether those outages occurred before or after the SRP work was completed. Fig. 1 and 2 below illustrate the outages pre and post work on one selected circuit.
Fig. 1 shows outage events that occurred before SRP work was complete on the circuit. The symbology identifies those that are spatially related to where work was eventually completed, and those that were not related to the work scope.
Fig. 2 shows outages that occurred after SRP work was complete along with SRP work locations. By separating outages into these groups, analysis could be performed comparing SRP to non-SRP related outages. To be related, those outages had to be both; within a specific proximity of the work and occur after work had been completed.
Calculating Circuit Performance
Once outages and SRP Work Activities were correlated, and unpreventable outages were identified, Circuit Performance metrics were derived using data that spanned a six-year window.
The data provided by Unitil included:
- Outages from 2014 through 2019
- SRP circuit work locations from 2015 through 2019 with sparse records for 2013 and 2014
- Storm data including storm name, storm time frame,and storm costs for 2014 through 2019
- Other associated data such as; poles and their locations from GIS and customer calls that were used along with the outage and work location data.
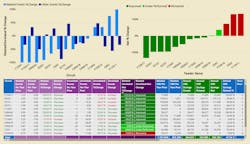
A circuit performance rating was calculated for each SRP circuit based on the reduction of Events per Year and CMI per Year for those SRP circuits. It was expected that SRP would result in reduced outage events and associated CMI where work was performed.
Fig. 5 shows the results of that analysis, illustrating which circuits had substantial reductions in outage events and associated CMI and which did not.
By calculating the percent change for the events and related normalized CMI a reasonable avoided annual CMI, or Annual CMI Savings, for each circuit was calculated. Similarly, this method supports the calculation of avoided SAIDI and SAIFI impact which was used to calculate customer savings from avoided revenue losses based on the Interruption Cost Estimate (ICE) calculator, developed by Lawrence Berkeley National Laboratory and Nexant and funded by the Department of Energy.
Demonstrating Reliability Improvement
Reliability improvement was calculated as changes in outage count, CMI, SAIDI, SAIFI, CAIDI, and outage duration, between the SRP and non-SRP circuits and circuit segments.
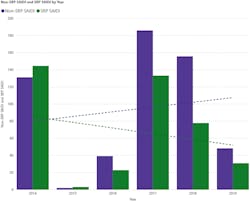
Fig. 6 below shows the SAIDI results of this comparison for all SRP and Non-SRP circuits when looking at storm related interruptions.
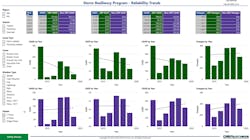
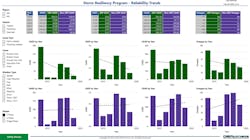
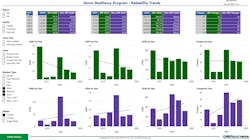
The graph shows an improvement over the six-year period where SRP circuit segments (green) had a reduction in storm related SAIDI relative to non-SRP circuit segments (purple). Additionally, when looking at all outages on the system the following trend graphs show a clear improvement in SRP circuit performance for SAIDI, SAIFI and CAIDI as compared to the non-SRP circuit performance. Interestingly, an increase can be seen in Outages by Year for all phases, due to increases in tree-caused outages on the single-phase portion of the circuits that were not maintained as part of the SRP program. The largest improvements in SRP circuit performance can be seen in the graphs for three-phase only performance (Fig. 8) particularly during storm events (Fig. 9).
The figure above shows that when considering all outages, universally the SRP circuits outperformed the non-SRP circuits based on all indices.
The figure above shows that when considering three-phase outages, the SRP circuits substantially outperformed the Non-SRP circuits based on all indices.
The figure above shows that when considering three-phase outages under storm conditions, the SRP circuits substantially outperformed the non-SRP circuits based on all indices.
As a control, a comparison was done between single phase outages and non-SRP areas. Single-phase outages under storm conditions tracked along the non-SRP circuits as would be expected since they are out of the SRP scope and did not receive any enhanced pruning, further justifying the data analysis validity.
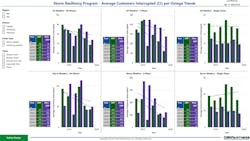
It was also important to decipher if the program was causing the avoidance of tree-related failures that cause significant damage. This is important as it evaluates the effectiveness of the program’s ability to avoid outages contributing to lengthy, costly restoration. In addition to less physical damage to repair, a shorter restoration time period reduces costs to the public as well as the cost of outside resources on the system, which can be large costs during storms. The figure above shows a comparison of Average Outage Durations for SRP and non-SRP circuits related to various weather conditions and phases. The Average Outage Duration under all circumstances is lower for SRP circuits than non-SRP circuits, with three-phase outages in storm conditions showing a significant difference in both the trend and average duration minutes. Additionally, the significant SRP based improvement is also validated by comparing storm condition three-phase against single-phase duration trends and duration minutes.
In addition to the data shown in Fig. 10, Unitil has found practical results of duration reduction in recent storm events, by being able to favorably complete restoration and provide mutual aid a record eight times in 2020.
Calculating and Projecting Customer Savings
While internal cost savings are associated with reduced system damage and shorter duration events, the largest cost savings impact comes from the avoided costs to customers. When customers experience an interruption event, there are real calculated costs such as lost sales, disruptions to manufacturing, loss of inventory and loss of worker productivity. The actual cost of an interruption depends on many factors such as the customer mix affected and the timing and duration of the outage. The avoidance of interruptions from the SRP is realized as savings for customers, which can be estimated through calculations.
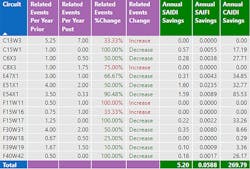
Calculating customer savings uses the derived number of avoided outages and avoided minutes of interruption to calculate annual SAIDI, SAIFI and CAIDI savings for each circuit, and the system. Fig. 11 below shows those derived values, as well as the values that drive the performance calculations, such as prior and post outages per year.
Using the annual SAIDI, SAIFI and CAIDI savings from the circuit performance calculations (Fig. 11) with the ICE calculator, the following external savings results for New Hampshire was estimated:
Three models were run consisting of differing pairs of the reliability metrics to derive the upper and lower savings results as illustrated below.
ICE data inputs and results:
- Inputting SAIFI of 0.0588 and of SAIDI of 5.20
- Results in ICE calculated CAIDI of 88.4 and savings of $1.246M Total Annual External Savings
- Inputting SAIFI of 0.0588 and CAIDI of 269.74
- Results in ICE calculated SAIDI of 15.9 and savings of $3.187M Total Annual External Savings
- Inputting SAIDI of 5.20 and CAIDI of 269.74
- Results in ICE calculated SAIFI of 0.019 and savings of $1.030M Total Annual External Savings
Next Steps
Unitil was able to effectively draw conclusions about the effectiveness of the Storm Resiliency Program by assimilating all the necessary data into a tool that is able to segment circuits by work status, remove refusals that are out of the company’s control, and parse data in different ways to view drivers and performance under specific conditions. Using the tool, Unitil saw a clear improvement trend in SRP circuit performance for SAIDI, SAIFI and CAIDI as compared to the non-SRP circuit performance as well as significant avoided costs to customers by avoiding tree-related interruption events.
The assessment results have been presented to state regulators to gain support to continue the SRP program with recovery of costs due to the benefits delivered to customers. In addition, Unitil is now using the tool for program analysis and ongoing decision making. Next steps include loading additional historical SRP work data from early program years for additional analysis and to proactively use the tool to prioritize high-impact and high-return-on-investment circuit segments of future SRP work locations.
Sara Sankowich ([email protected]) is the manager of forestry operations & sustainability at Unitil Service Corp where she manages the development and implementation of the vegetation management program. She has been working in the utility arborist field for 20 years. Sara has a BS in Forest and Natural Resource Management. She is a past president of the Utility Arborist Association and is the current president of the New England Chapter of the International Society of Arboriculture.
Paul Bower ([email protected]) Paul has 25-plus years of experience in the utility industry where he co-founded three software companies that achieved market dominance in OMS/DMS and advanced analytics; CES International, now Oracle NMS; Obvient Strategies, now part of ABB; and OBI Partners where he is currently the EVP and chief solution architect.
About the Author
Sara Sankowich
Sara Sankowich is the manager of forestry operations & sustainability at Unitil Service Corp where she manages the development and implementation of the vegetation management program. She has been working in the utility arborist field for 20 years. She has a BS in Forest and Natural Resource Management. She is a past president of the Utility Arborist Association and is the current president of the New England Chapter of the International Society of Arboriculture.
Paul Bower
Paul Bower ([email protected]) has 25-plus years of experience in the utility industry where he co-founded three software companies that achieved market dominance in OMS/DMS and advanced analytics; CES International, now Oracle NMS; Obvient Strategies, now part of ABB; and OBI Partners where he is currently the EVP and chief solution architect.
