Real-time Algorithms to Detect Clouds and Forecast Photovoltaic System Performance
Solar power provides a much-needed non-carbon energy source that is dependent on sun radiance. But sunny days are inherently unpredictable and variable, due to atmospheric conditions such as cloud cover. When clouds roll over photovoltaics (PV) arrays, PV systems' output power fluctuates, causing energy imbalance and technical problems such as voltage instability in distribution networks. Expert have found PV losses can be up to 80% during such transitions caused by an overpassing cloud shadow, which can cause significant inefficiencies in grid planning and operations as PV penetration into distribution networks increases.
“As PV installations grow across our service territory, forecasting real time power output from each site becomes imperative to a smooth and reliable operation of the electric grid.”, said Umair Zia, director of Distributed Energy Systems at Eversource.
In Oct. 2020, T & D World posted a paper about Eversource Energy’s collaboration with Worcester Polytechnic Institute (WPI) researchers to design a model to compute and indicate a flicker moment on the grid as a function of change in irradiance due to cloud cover.
Building on the success of the 2020 study of varying weather patterns, WPI researchers under supervision of Prof. Mughal, assistant professor of teaching in the electrical and computer engineering department, have designed a CMVS system to help grid operators detect cloud cover in advance and improve local and short-real-time forecasting of PV system performance. The team of researchers at WPI have developed real-time predictive algorithms that can predict local and real-short-time clouds activity with high accuracy as well as forecast PV system performance. Power management companies can benefit from the two algorithms to better manage grid integration of renewables and non-renewables in the energy mix.
The Cloud Motion Vector Sensor (CMVS) System
The hardware design of the CMVS system consists of nine TSL2591 light sensors by Adafruit, two TCA9548A 1-to-8 I2C multiplexers by Adafruit, an ESP32 MCU by Espressif Systems, and a power circuit to power all the electronics.
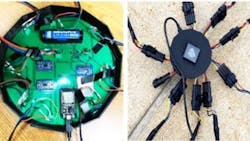
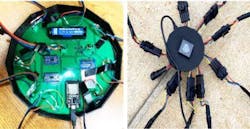
To protect light sensors from the environment, the research team designed 3D printed enclosures with a sliding jacket to fit a UV-VIS grade fused quartz glass plate on top of the sensor, as shown in Fig 2 The design also includes holes to maintain a fixed position on the ground. Each sensor was separated by an equal distance and angle, and the wiring cables were protected with heat shrinking and weatherproof tubing.
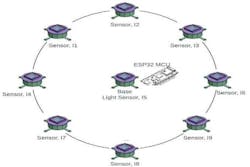
The CMVS design is a cluster of nine-light sensors designed in a circular arrangement (Fig 3), 45 degrees apart and 12 ft away from the base light sensor, which is placed at the origin (or center) and mounted on top of the CMVS PCB development board. The board houses two multiplexers and an ESP32 microcontroller (MCU), a low-cost development platform for embedded applications with integrated Wi-Fi and Bluetooth technology and was used collect irradiance measurements from all nine light sensors.
The CMVS system model block diagram is shown in Fig 4. Aambient light data is transmitted using multiplexers to ESP32 MCU via I2C protocol. The data is then transferred onto ThingSpeak via WiFi connection for algorithmic processing. The cloud detection algorithms are designed in a Matlab environment, and ThingSpeak enables to schedule and run Matlab scripts, which then computes cloud motion parameters such as cloud speed, direction, and length.
PV System Model
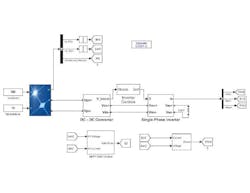
The predictive PV system model is designed in Simulink/MATLAB. The model utilizes an intelligent perturb and observe (P&O) maximum power point tracking (MPPT) algorithm to track the maximum power and predict the performance of the PV system as a function of solar irradiance and temperature measurements. The two measurements are acquired using a LI-200R pyranometer by LI-COR Inc. and a TMP102 digital temperature sensor by Sparkfun operating at 1 Hz frequency.
The model uses a two-stage inverter design to generate power output from the PV array configured with same settings as the one installed at WPI campus. In the first stage, a boost converter is used to increase voltage, and then a two-level inverter topology is used to convert direct current power to alternating current power.
Boost converter with proportional plus integral (PI) control is used to implement the two-stage inverter followed by sine wave pulse width modulation (SPWM) control for the two-level inverter configuration. The Boost converter is controlled through the P&O MPPT controller. The resistive load is used at the inverter output terminal. The diagram of the predictive PV system model built in Simulink is shown in Fig 5.
Performance Testing of Algorithms
The synthetic dataset was used to train and test the performance and accuracy of the CMVS model. In addition, the algorithm was tested using real-world conditions by placing objects near each sensor in order to cast shade on them. Finally, CMVS design was installed at a known distance and angle in close proximity of the WPI PV site for real-time prediction of the cloud parameters, which includes cloud speed, direction, length and depth of the cloud as well as time it will take for cloud to reach the PV site. Thingspeak, an API-based IoT platform service, was used for data collection from sensors, algorithmic processing, visualization and monitoring of the real-time data.
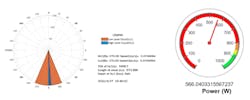
Matlab scripts iterate through the TSL2591 light sensors to record the irradiance measurements for algorithmic operations and compute cloud motion parameters. ThingSpeak enables to schedule and run Matlab scripts at regular interval of time. Similarly, the predictive PV output power values from the Simulink model were sent to ThingSpeak for visualization. The refresh time for auto-reload was modified to 10 sec using META refresh HTML function for monitoring cloud motion and output power of the PV system in real-time as shown in Fig.6.
In Conclusion
The unique CMVS system model, which detects cloud and compute cloud motion parameters, can predict local and real-short-time information about clouds that grid operators can use to manage better grid integration of renewables. One significant advantage of the CMVS system design is the scalable deployment CMVS system forming a big network of sensor clusters, which, if spread throughout the PV Site (or city) can help forecast PV output power of multiple PV systems within a short distance.
This brings society a step closer to a concept of a smart city with more efficient and reliable microgrid systems. “The findings of this research and the CMVS model, will be a value-add to a future distribution management system.”, said Umair Zia, Eversource. Although there are a few limitations to the model in terms of accuracy falling short when there is a significant change in irradiance in a short time from cloud cover, the overall performance of the model was satisfactorily exhibiting an accuracy of 84% when compared to the performance of the actual PV system.
The research team has prepared a more technical report for interested design engineers. Next WPI researchers plan to deploy an onsite computer version at WPI’s Farm Stay Project Center, where the team will capture real-time cloud conditions and further validate the CMVS forecast system. The Farm Center is a 58-acre working farm and nature education center, with vegetable gardens, farm animals and a full-time day care facility. WPI students in residence and visiting researchers to the farm engage in projects around renewable energy, climate resilience, organic food production, sustainable forest management, and more.
About the Author
Maqsood Ali Mughal
Maqsood Ali Mughal is an electronics engineer and is currently an assistant professor at Worcester Polytechnic Institute. His research interests revolve around investigating next-generation materials for use as solar cell materials to reduce cost and toxicity, while increasing energy conversion efficiency. He is especially interested in exploring the possibility of using these materials for aerospace, biomedical, and other applications. Mughal's professional experience lies in academics, and in the oil, telecommunication, and energy industries.
Habeebullah Adua
Habeebullah Adua is engaged in research in the electrical & computer engineering department at Worcester Polytechnic Institute in Worcester, Massachusetts.
Muhammad Hammad Uddin
Muhammad Hammad Uddin is engaged in research in the electrical & computer engineering department at Worcester Polytechnic Institute in Worcester, Massachusetts.
Evan Sauter
Evan Sauter is engaged in research in the electrical & computer engineering department at Worcester Polytechnic Institute in Worcester, Massachusetts.
Stephen Natale
Stephen Natale is engaged in research in the electrical & computer engineering department at Worcester Polytechnic Institute in Worcester, Massachusetts.
Jonathan G. Ferreira
Jonathan G. Ferreira is engaged in research in the electrical & computer engineering department at Worcester Polytechnic Institute in Worcester, Massachusetts.
