Debunking Punting Pundits and 'Dimensional Analysis'
Compound interest may be, as Einstein said, “ the eighth wonder of the world,” but it is also a source for much misplaced enthusiasm when it comes to some smart grid market growth projections.
Have you ever started reading a press release about a smart grid technology-related trend or analysis, which talks about seemingly high growth rates, only to dig deeper and arrive at the disappointing realization the growth projections were actually nothing to get excited about?
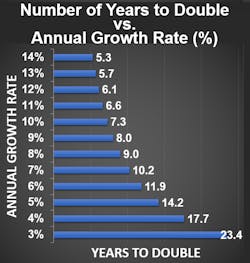
For a smart grid technology to double in 10 years could mean it is a great and important area in which to invest or do research (or get a job), or it could mean it is a relative dud.
Why? Consider a technology segment like Volt/VAR optimization, which includes a small portion of sophisticated Volt/VAR Optimization (VVO) solutions, and a much larger portion served by older technologies, including transformer load tap changers (which were invented in the 1920s).
Revenue in such a “smart grid” market segment will double in 10 years if it grows at 7.2%.
But in our industry, natural replacements of failing T&D equipment (~4%), along with installations to serve new load growth (~2%) and general price inflation (~1%), could lead a segment’s revenue to double in ten years, even though the “smart grid” portion of that segment may, at the end of the ten year period, still be relatively small, revenue-wise.
In much the same way as we have weather-adjusted fuel usage statistics, and inflation-adjusted cost-of living figures, shouldn’t we should adjust our smart grid statistics based on a “what would have happened anyway?” sort of standard?
In analyzing key industry trends, the optimism or pessimism level of the analysts may lurk not only in their growth rate projections, but also in other mathematical units they use when reporting their findings. When these involve units of spatial measure, the misinformational “fudge factor” increases exponentially, as we go from linear units for distances, to two dimensional units for surface areas, to three dimensional units for volumes. For example, consider this question:
- Technology XYZ will produce, annually, a volume of solid waste which will fill a cube 200 feet in length, width, and height.
- Technology ABC will produce, annually, 8,000,000 cubic feet of the same type of solid waste.
“Innumerate” readers would view the second volume as being much larger, but of course the figures are equal, since 200 x 200 x 200 = 8,000,000.
And finally, I couldn’t resist doing the math when I recently looked back at a 2013 prediction about the uptake of solar PV installations by a widely-respected, widely-published firm in our industry. The report predicted, in 2013, that by 2016, there would be a new solar PV installation in the U.S. every 83 seconds.
Big deal? Maybe. But maybe not. Having an annual number of installations which equates, in optimist’s units, to the “amazing” figure of one every 83 seconds for a year, is, in pessimist’s units, equivalent to “only” 380,212 such installations in the same year.
The same 2013 report, glowing reference was made to an Energy Efficiency (EE) trend which said that EE technologies were going to double between 2010 and 2025.
Do we know now how to answer whether it is exciting for something to double after 15 years? It doesn’t take an Einstein to tell us what else will double after 15 years--anything growing at 4.73% annually, that’s what.
About the Author
Peter Arvan Manos
Utility Industry Analyst
Peter Manos is Director of Research for Electric Power & Smart Grid, on the Energy Sector team at ARC. He analyzes the latest trends across People, Process, and Technology to uncover business and digital transformation best practices for electric, gas, and water utilities. He can be reached at [email protected]

