Industry Challenge
Transmission line structures, foundations, conductors, and hardware are installed in a wide variety of environmental conditions and are continually subjected to environmental stressors that can cause corrosion. Depending on the component’s material, design, and compatibility with the environment, these stressors affect different parts differently. Utilities can be more effective by accounting for the environment when they:
- Design assets and mitigation approaches
- Optimize inspection practices
- Select refurbishment approaches
- Manage replacement cycles
To manage corrosion more effectively, utilities need better asset-specific models for the corrosivity of the atmosphere and soil for their environment.
EPRI’s Response
EPRI has developed an approach to developing models that allow utilities to create GIS maps that visualize atmospheric corrosivity and subgrade corrosivity specific to different assets. Utilities can then use these models to influence their design practices, inspection, and mitigation approaches.
Government weather and contaminant data and data from test samples harvested in the field are used to create the models. Researchers then validate the accuracy of the models using condition assessments from multiple surveys.
Progress, Results & Next Steps
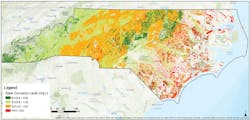
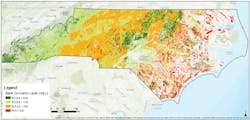
EPRI researchers have analyzed data from thousands of structure condition assessments to develop soil corrosivity models and maps for participating utilities. More than 600 soil samples have been characterized for corrosivity as a function of moisture and temperature to validate certain regions of EPRI’s U.S. soil model. The maps are divided into six regions, with the southeast region having the greatest resolution (see Figure 1 for an example), followed by the Northeast. Additional research will continue characterizing soils throughout the United States to increase resolution in the remaining regions.
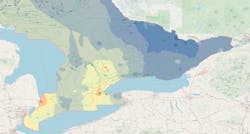
Atmospheric corrosion maps for conductors, structures, and hardware have been completed for some North American regions, with international assessments underway. Figure 2 is an atmospheric corrosion map for Ontario, Canada.
How to Use the Research
Corrosion maps provide valuable asset information to many stakeholders within a utility. Understanding degradation rates can fine-tune a utility’s maintenance forecasts, O&M budgets, and replacement schedules. In addition, it informs utility design standards to account for environmental effects.
How to Get Involved
Utilities can engage in this research by submitting soil samples and data from condition assessments to increase the accuracy and resolution of the model. Results can be developed that are specific to a utility’s construction standards and environment within their service territory.
About the Author
Neal Murray
Neal Murray is a technical executive responsible for corrosion research for T&D at EPRI.


