Wind farms are often monitored and controlled by operators sitting in offsite control rooms. As with any control room, it is essential that the operator has timely access to the right information so that the installation can be kept running smoothly. Furthermore, it is of the utmost importance that the information is presented in an intuitive way as this will enable the operator to perceive, interpret and react appropriately. In order to do this effectively, it is necessary to understand the needs of the operators.
Every wind turbine generates large amounts of data – such as wind speed, wind direction, ambient temperature, bearing temperature, rotor speed, nacelle direction and hydraulic pressure. Add in production data such as active power, reactive power and daily production, and multiply this all by the large number of turbines found in many farms and it becomes clear that operators have to handle a relatively large amount of data compared with other, similar installations, such as hydropower plants.
By interviewing and observing users in their real working environments, valuable insights can be gained into the key human-machine interface (HMI) design considerations that relate to how all this data can be best presented. From a series of interviews and observation sessions with control center personnel who deal with renewable plants, in particular wind farms, various high-level operator requirements have been identified.
The requirements include the need to:
- Understand and interpret the layout of the wind farm.
- Detect, comprehend and resolve alarms quickly.
- Get support for planning ahead (eg, maintenance).
- Be aware of the current situation.
- Quickly navigate between different parts of the system to access the right information - energy produced, trend data, alarm data, nacelle information, etc.
- Be informed about the status of the electrical substation linked to the wind farm.
Design concepts
With these considerations in mind, ABB has developed two prototypes. The first prototype used 2-D visualization to display wind farm information. This design focused on a PC-based user interface integrated into the Symphony® Plus system (ABB's automation platform for the power generation and water industries).
A first phase of the prototype was made available to customers at the end of 2014 and the remaining features are scheduled to be released in 2015.
Features of this prototype are based, in part, on the ASM (abnormal situation management) Consortium Guidelines for Effective Operator Display Design 2008 [1] and include the ability for operators to:
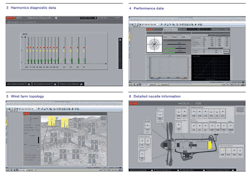
- Easily navigate between different information levels (eg, nacelle view, trends, alarm list, diagnostics) ➔ 1-3.
- Access details (eg, wind speed, wind direction, target values, generation performance) of individual wind towers by using hovering interactions ➔ 4.
- Switch between different views of the entire wind farm. This could be a representation of the wind turbines in a straight-line, schematic fashion, for example, or a view reflecting the actual farm topology and turbine separation ➔ 5.
- Navigate to a more detailed view of the nacelle for a selected tower ➔ 6.
- See desired information on a single screen (eg, wind farm overview, single nacelle view, alarm list).
- Compare certain parameters for several nacelles on the same screen.
- Save a wind tower’s data in a "safe area" in order to analyze its behavior later.
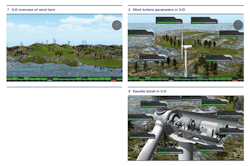
The second prototype investigated if three-dimensional techniques could be applied to visualize wind farm information and thus improve the operator's understanding of weather data and the relationships between towers. A 3-D representation can be more intuitive and effective when linking specific wind farm data with the physical turbines ➔ 7-9.
Both approaches have been well received by customers and efforts are underway to provide hydropower plants and solar plants with a comparable product that has the same look and feel, and a similar type of support for decision making and monitoring.
Operators benefits
Following the completion of the initial designs and prototypes, the step-wise implementation into the Symphony Plus platform was continued. Further displays have been realized that help operators to more effectively manage their wind assets, from high-level, map-based presentations of the generation portfolio to dedicated displays for each wind farm, wind turbine and individual components. The implementations closely follow the design criteria and guidelines defined in the prototypes and also use a new color palette. The information is presented to the operator in a more structured way and the ability to smoothly navigate between various parts of the system – such as trend displays, faceplates and alarm management systems – allows operators to react to events in the field more efficiently.
For the 3-D design, a connection between the application, which resides on a mobile device or desktop PC, and the database containing the plant data was implemented. This real-time connection allows field personnel to instantaneously obtain information about the asset while they are performing repair and maintenance work.
Customer benefits
This automation solution provides customers with an intuitive interaction experience. The design philosophy centers on improving situation awareness and thus improving support for decision making. By providing operators with enhanced navigation and better information visualization, the application presents the information they need, when they need it – and in a way that makes sense to them. This has a direct positive impact on the effectiveness and productivity of operators working within this domain.
With the new HMI concept, customers can see the relevant information at the portfolio level – split into country, region and plant type. Effective navigation allows a quick transition to the important details of every component – crucial when these details are needed to support informed decision making. Situation awareness is further improved by the powerful alarm management system, which helps guide the operator’s attention toward the important events in the field.
Productivity and operations efficiency are boosted by an innovative way of displaying data. Instead of just showing the relevant numbers onscreen, their relation to lower and upper allowed margins is also displayed. This helps operators to more effectively detect inconsistencies or problems at first glance, thus reducing the effort required to understand abnormalities in the system's behavior.
This ABB offering for the wind power domain helps remote operators connect more directly and effectively with the process they are meant to control. With it, operators are able to make sense of the large quantity of data generated by wind farms and are in a position to easily and effectively assess situations, access the right information and act quickly and appropriately.
Maria Ralph Susanne Timsjö
ABB Corporate Research
Västerås, Sweden
[email protected]
[email protected]
Adrian Timbus
ABB Power Systems
Zurich, Switzerland
[email protected]
Stefano Doga
ABB Power Systems
Genoa, Italy
[email protected]
Reference
[1] ASM Consortium Guidelines: Effective Operator Display Design. Available: http://www.asmconsortium.net/Documents/ ASM_Handout_Display.pdf


