Crews Track Danger Trees in New Mobile Application
Every electric utility across North America has one central mission — to keep the lights on for its customers. Overgrown vegetation and danger trees, however, can inflict unplanned outages for line crews.
Case in point: the 2003 blackout can be traced back to vegetation management issues on a transmission right-of-way (ROW) in Ohio. Because of this event, the North American Electric Reliability Corporation (NERC) developed a special focus on transmission vegetation management and its impact on reliability. Utilities responded to this focus by redoubling their on-ROW vegetation management efforts and implementing technologies that enhance their ability to detect and mitigate so-called danger trees at and beyond the edges of transmission ROW.
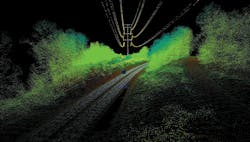
The New York Power Authority (NYPA), for example, has implemented an aerial mapping technology called light detection and ranging (LiDAR) that can identify vegetation, including danger trees that could pose a danger to transmission lines. NYPA, which manages 1400 circuit miles of transmission lines, has been using LiDAR to survey its facilities for years, but it just recently started including danger trees in its measurements. In the near future, line crews will start using an advanced mobile application to pinpoint which LiDAR-identified trees off a ROW need to be cut down.
The remote-sensing survey method uses laser pulses, along with other data collected by the airborne system, to calculate precise 3-D downloadable measurements. The technology provides accurate and uniform spatial models of NYPA’s transmission structures, power lines, ROW topography and nearby vegetation.
By building these models, NYPA has created a “digital twin” of its transmission facilities to complement the digital twin of its generation and switchyard facilities under development in its new Integrated Smart Operations Center. As such, the utility can proactively identify possible problems before they cause service outages.
NYPA’s Vegetation Management Approach
While NYPA is just recently mapping its danger trees with LiDAR, its focus on vegetation management stems from its integrated vegetation management (IVM) approach initiated in the late 1990s. Back then, the system forester advocated fostering the growth of low-growing and dense vegetation, which tends to shut out or inhibit the growth of non-compatible species such as tall-growing trees. By following an IVM regimen for a sufficient number of cycles, NYPA ultimately could use less herbicide and reduce manual cutting effort, therefore reducing costs while benefitting the environment.
The system forester worked with NYPA’s geographic information system (GIS) group to help NYPA meet its vegetation management and reliability goals. The system, which was developed by both the GIS and forestry groups, is based on a four-year management cycle and addresses ROW vegetation inventories, treatment prescriptions and as-treated vegetation records using mobile computers and GIS technology.
The first year of the cycle, field biologists perform a detailed vegetation inventory with the location of the vegetation down to one-tenth of an acre. The biologists collect data such as the species (segmented into compatible and non-compatible species), density of stems per acre and average height for each of the species. They then recommend a treatment for each vegetation management unit. The recommended treatments and related GIS maps are used to determine the level of effort and budgets for the following year. The second year of the cycle, the lines inventoried the year before are treated, and the actual treatments used are recorded using a mobile GIS-based application. The third year of the cycle any remaining deficiencies in the previous year’s treatments are remedied. The fourth year no on-ROW vegetation management is typically required.
Meanwhile, the line crews identified danger trees through a manual process. With an experienced set of eyes, they used handheld survey devices to verify the height of the trees near the conductor as well as those trees in the immediate vicinity. While the linemen couldn’t calculate the maximum sag of the conductor, they could locate and remove the danger trees. This system has been effective, as NYPA has not had any vegetation management-caused outages in more than a decade.
One of the issues, however, was that the process by its nature was focused on the visible trees adjacent to the ROW edges. Once the trees were cut, the potential danger trees that were blocked by the trees visible at the ROW edges also became visible, engendering another round of identification and mitigation. The diligence of the crews in this task ensured that the system remained reliable, but the level of effort remained at a relatively high “irreducible minimum.”
Automating the Danger Tree Process
Over time, NYPA began patrolling its vegetation and infrastructure from the ground and from above. The utility has been flying one-quarter of the transmission lines with LiDAR technology every year since 2013, using the resulting data both to develop the digital twin of its transmission system and to double-check on-ROW vegetation treatment effectiveness.
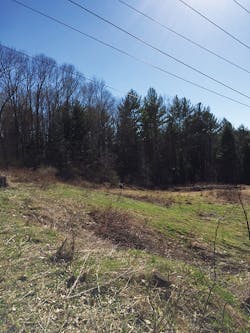
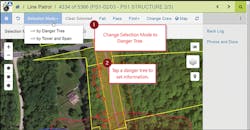
With LiDAR, NYPA can model its transmission facilities and the conductors themselves. In addition to modeling the conductors, NYPA is also now mapping the area underneath and to either side of the transmission line corridor. Any trees of sufficient height to cause outages located within 50 ft of the ROW are detected by LiDAR and reported back to NYPA as danger trees. They are then mapped in the GIS and displayed in the mobile application developed by the contracted mobile application vendor.
As a result, the utility can determine — with a high degree of precision — where the wires are at maximum sag and at maximum load during the hottest day in the summertime or in the strongest winds. Through the LiDAR technology, NYPA can identify issues such as whether the line will get too close to the ground or sway side to side, potentially causing outages. Because LiDAR detects danger trees from the air, the lack of visibility of danger trees behind those visible from the ground is no longer an issue.
NYPA expects that the next few vegetation management cycles will result in a significantly lower irreducible minimum of danger trees, resulting in lower annual danger tree remediation costs and even greater reliability. By analyzing the GIS data from the LiDAR technology, NYPA can determine the exact location of the trees that must be cut, who owns the trees and whether or not they are located on a ROW. If the danger trees are situated outside the easement, NYPA’s real estate employees must work with the landowners to buy the trees. Another consideration is whether or not the danger trees are located in an environmentally sensitive area.
Through the application, the line crews or foresters will visit each of the danger trees to determine removal priority and gather other data such as species and diameter. The linemen then write up the danger trees in a work order from the field using the mobile application, which is integrated with Maximo, NYPA’s enterprise asset management program.
Until recently, the danger tree portion of vegetation management reporting was not automated. Today, line crews can collect the data, NYPA’s real estate and environmental teams can assess the danger trees, and then the line crews are scheduled to trim or remove the danger trees, all in an automated work flow.
To collect the data, NYPA’s linemen rely on tablets with detachable keyboards and cellular capability. If possible, the linemen synchronize the tablets live from the field if they are in an area with strong cellular coverage.
Because the cellular service can be poor in large areas of upstate New York, NYPA set up its mobile applications so the linemen can use them in a disconnected mode. They can then synchronize the data before they leave in the morning and then immediately when they return to the office, operations center or a hotel if they are working out of town. This allows crews working on the same line to discover what other crews have already done. That way, work won’t get repeated and no areas of ROW are missed.
The new application replaced an early laptop-based mobile application. When the linemen conducted their line patrol, they recorded the data on the hardware, the transmission lines and the structures within this application. Over time, however, it became incompatible with current software and obsolete. Also, the former software couldn’t handle the reporting of danger trees, and because different crews handled this data differently, it wasn’t practical to program it using the previous application.
Recently, NYPA standardized its danger tree process, which allowed the utility to program the danger tree application. As a result, it has become part of the utility’s overall inspection.
While changes often stem from management, the line crews were responsible for driving the shift from the former software to the new application. When discussing the replacement of the original line patrol application to a modern one, the linemen were pleased with the news, but they demanded a new program that included the capability to record data about the danger trees as well as the condition of the lines and hardware.
Working as a Team
As part of its software rollout, NYPA had to focus on training its crews. Since the late 1990s, NYPA has applied mobile GIS to various transmission business units. To ensure that it had buy-in from the field crews from the start, NYPA invited the end users — the foresters and linemen — to share information about how they did their jobs, their work flow and what they were looking for as far as automation. This approach was continued with the recent mobile application development. The end users — linemen, foresters, transmission supervisors, planners and engineers — reviewed each step in development of the application and their feedback was incorporated into the final product.
This team approach has paid benefits to NYPA by producing an effective mobile solution that not only enhances its already excellent reliability record but is well accepted by its maintenance forces. ♦
John Wingfield is the manager of surveying, mapping and GIS for the New York Power Authority. He has been with the utility for 33 years.
About the Author
John Wingfield
John Wingfield is the manager of surveying, mapping and GIS for the New York Power Authority. He has been with the utility for 33 years.


