Global Electric Demand Declines; Is an Economic Tsunami the Next Disaster?

Emergency measures intended to prevent the spread of the novel coronavirus are being enforced by governments all over the world. These measures are significantly altering daily routines and business operations on a massive and unprecedented scale. A significant decline in electric consumption is being noted globally due to the COVID-19 emergency.
What is the Electricity Demand Curve?
The electricity demand curve is the 24-hour electricity demand. It is not constant during the 24-hour period. As one would expect, the demand for electricity increases during the morning and reaches to a small hump, levels out over the day, and then rises to a larger hump in the evening. There is usually a typical curve for working days and a typical lower curve for weekends. In the past, the electricity demand curve was called a camel with two humps. Today, the high solar photovoltaic energy in the distribution system during the day reduces the demand, and the midday section becomes steeper. Thus, the traditional camel curve became a duck curve.
Impacts on Electric Demand
New work-at-home requirements, school closures, and quarantines are significantly altering daily routines for both consumers and business. Utilities all over the world are seeing declining demand for electricity, with commercial and industrial (C&I) businesses likely responsible for most of the impact due to business closures. It is also predicted that there may, in some cases, be a slight increase in electricity usage by the residential sector due to more people staying at home.
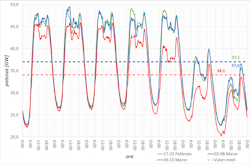
Italy has recently become an epicenter in the COVID-19 outbreak. The measures to contain the COVID-19 pandemic in Italy can be divided into two phases: a legislative decree on Feb. 23, 2020 covering Northern Italy, and a second phase following a decree by the Prime Minister on March 9, 2020 with restrictions covering all of Italy. The Italian grid has experienced a significant reduction in electric demand on its system, with some reports as high as an 18-21% reduction in demand. After Feb. 23, a 1-1.5 GW reduction to system load occurred. Following March 9, there was a 3GW reduction.
In Italy, the reduction in load has also shifted the generation mix, decreasing thermal production. There are mixed reports on the impact to renewable sources, primarily based on renewable resource availability and reduced demand. Wood Mackenzie indicates a change in non-dispatchable renewable resources, with a 46% decrease in wind energy and a 24% increase in solar. Another report in Energia by Italian energy experts show an increase across renewable resources as a whole. The decrease in energy demand has also impacted energy prices due to a change in supply and demand.
Electric Load Profile Comparisons in Italy
Other graphics that show Italy’s decline in electric demand appear even more striking, and show demand adjusted with the weather.
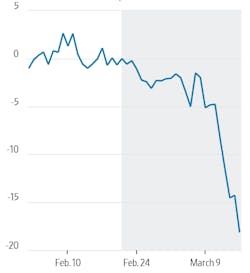
The analysis below shows that in Italy, the reduction due to the measures to contain the pandemic is alone responsible for more than 17% reduction with respect to normal demand levels, while the weather accounts only for 2%.
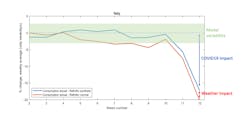
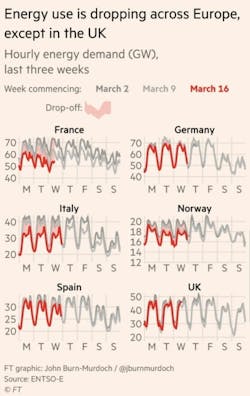
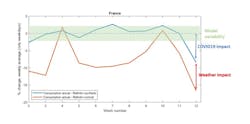
Decreases in demand are being seen in many countries across Europe. Demand in Spain over the weekend of March 14-15 was down 5.6% compared to the previous week, although the week overall was broadly in line with the previous year. The French demand has been more than 15% below normal levels, compared to the prior 12 weeks, but the effect is almost equally divided between weather impact (8% reduction) and COVID-19 impact (8% reduction). Peak consumption in Ireland is currently being reported as 8 to 16.7% lower than the last seven weeks. There has been no change in demand in the United Kingdom. However, other experts have pointed out that the United Kingdom only started locking schools last Friday, and it is logical that no load reduction has been seen yet. Most countries are not showing as much of a comparative decline on the weekend, as during the weekdays. Some are also reporting a reduction in night-peak, which may be due to the closure of restaurants and pubs. Below are several graphical examples of the load impacts being observed.
Across Europe
France
The below analysis of declines in France shows the effect of weather.
Ireland
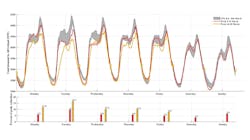
Interesting, the biggest reduction in Ireland is shown to have occurred on St. Patrick’s Day.
Electricity Consumption in the United States
Real-time data about electric grid usage is not as readily available to the public in the United States as in Europe. However, preliminary reports of declining demand are beginning to trickle in, as more stay-at-home orders are issued, especially in areas hit hardest by the virus. This data indicates that the United States is following the same trajectory seen in Europe.
A few utilities have reportedly told The Wall Street Journal that they have already seen declines. Snohomish County Public Utility District saw a 3% drop in electricity demand in one day. Spokeman Aaron Swaney said, “We missed our hourly forecast by quite a bit. All of our power supply folks are keeping a close eye on it.” Portland General Electric also said it was beginning to see effects on usage. Other utilities have indicated that they expect to see changes in demand in the coming days.
The Midcontinent ISO (MISO) reports that system demand is down 18% compared to March 2019 and down 13% month to date compared to the March average since 2014.
ISO New England, has also reported a decline in system demand of approximately 3% to 5%, compared to what would normally be expected under weather conditions in the region.
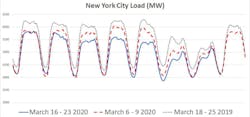
The following data has also been reported out of New York City, which also shows a decline in demand, but does not factor in the effects of weather. The demand his dropped about 9-10% compared to similar weeks last year, or about 3-4% compared to last week. It is predicted to drop more than 3-4% this week, given the full lock down.
Potential Utility and Economic Implications
At this point, many utilities in areas impacted by COVID-19 are seeing a reduction in electric demand.The spring season is not a time of peak usage on the electric system, so a reduction in demand is not a concern from a reliability or capacity perspective.The challenges to operate the grid during low demand are less serious than the challenges of operating the grid during high demand. Utilities have the tools to handle this.
However, a decline in usage may cause adverse financial impacts to utilities and their customers, especially if the declines continue into the summer months. Utility revenue projections are typically closely tied to their load forecast. A decline in electric usage over a sustained period may cause utility financial implications, which then may lead to credit ratings downgrades, or utility rate cases. In the United States, the particulars of utility ratemaking vary for each jurisdiction, and can even vary slightly amongst different companies. For example, some states have rate decoupling, which decouples revenues from sales volumes. However, in many states normalized billing determinants (normalized energy and demand usage by customer class) is one of the common components used to calculate utility rates. A sustained reduction in usage, could impact a utility’s ability to cover their cost to provide service or shift costs to other customer classes. In the event credit rating agencies do issue a downgrade for utilities, it would mean that utilities will pay a higher interest rate when borrowing money. The likelihood and extent of any utility financial impacts will depend on how long this all continues, especially if it lasts into the summer months when electric utilities typically expect to see peak usage. Any financial impacts to utilities are usually ultimately also felt by their customers, and in this case, during a time when consumers are already worried about the economy and paying bills.
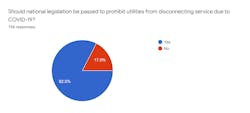
T&D World recently conducted a survey to gauge how many customers are concerned about paying their utility bills. Almost a quarter of customers indicated they were concerned about their ability to pay for electric utility services due to COVID-19. A large majority of customers also appear to support having national legislation to prohibit utility disconnections during this public health emergency. Thankfully, many states and utilities have already suspended utility service disconnections.

It is rather unusual for the general public to have interest in electric utility load curves. However, many people and investors are starting to take interest in this data because it can provide insights about the overall state of the economy. China has the largest electricity demand, followed by the United States. Nordic and Gulf countries have the largest electricity demand per capita.
Electric consumption is often highly correlated with indicators of employment and overall economic activity. Although, it is important that one understands exactly what data they are looking at because, as evidenced in some of the previous examples, raw usage data will also include impacts of weather. The reduction of electricity demand normally happens as a result of a recession, or in these cases, a lockdown due to COVID-19. One thing is for certain, the data is showing a global decline in electricity consumption on an unprecedented scale and may very well be pointing toward a larger economic crisis to come.
About the Author
Martha Davis
Senior Director of Content
Prior to working at T&D World and Utility Analytics Institute, Martha worked as an executive in the energy industry for about 15 years. She has held various regulatory and government affairs positions and had the opportunity to shape public policy.
Martha has a B.A. from Westminster College in Fulton, MO; completed specialized legal and public policy coursework at American University in Washington, D.C.; M.P.A. Public Affairs and M.B.A. Business Administration both from the University of Missouri. She is currently a doctoral candidate at the University of Denver where she is researching business analytics, innovation and regulation.