An Altered Path to the Future Grid
The potential of distributed energy resources to radically transform how utilities manage their T&D systems has been recognized throughout the industry. To take advantage of this potential, Southern California Edison (SCE) has focused heavily on developing new tools and methods that will transform its distribution grid into an agile platform better suited to manage both the challenges and opportunities associated with new technologies.
History of Modernization
While SCE has long emphasized environmental stewardship and responsibility, a confluence of three factors has further impelled the utility toward grid modernization:
- Market
- State policies
- New technologies.
The market has seen the introduction of a wide array of distributed energy resources (DERs), which — combined with lower costs — have led to an increase in customer adoption. While photovoltaics (PV) are, by far, the most widely adopted DER, traditional energy efficiency and demand response still have a substantial effect. Meanwhile, electric vehicles and battery storage are becoming more prevalent, but are not as well understood. SCE has around 220,000 customers enrolled in net energy metering (NEM) and expects this to grow to 1 million within the next 10 years. This means one in five customers will have some form of qualifying DER resource. Since it is highly unlikely these DERs will be uniformly distributed across the distribution system, they surely will have an outsize effect in some areas, necessitating planning at a more granular level.
California state policies have driven customer adoption of DERs even further. In addition, California legislation has led the U.S. over the past decade with aggressive greenhouse gas (GHG) reduction targets. Assembly Bill 32, which passed in 2006, required California to reduce GHG emissions to 1990 levels by 2020. While SCE accomplished this in 2016, newer bills have established even more ambitious targets. In 2016, the legislature passed Senate Bill 32, requiring the reduction of GHG emissions to 40% below 1990 levels by 2030. Finally, Senate Bill 100 established a policy that eligible renewable energy and zero-carbon resources supply 100% of all retail sales of electricity by 2045.
For SCE, the effect of this legislation manifested itself in several areas. Initially, proceedings and working groups for the utility’s Distributed Resource Plan (DRP) contributed key elements to its 2018 and 2021 general rate cases, which were filed in 2016 and 2019, respectively. Later, this influence was evident in two SCE initiatives, 2017’s Clean Power and Electrification Pathway and 2019’s Pathway 2045, which defined plans for electrifying the grid to meet the GHG reduction goals.
The emergence of new technologies has improved the safety, reliability and resiliency of the T&D system. However, given their association with the internet, new technologies introduce new challenges, as they can make the system more vulnerable to cybersecurity threats. The ability of these threats to disrupt and disable system operations means new technologies need to be phased in cautiously, with grid modernization tools playing a key role in assessing and mitigating the potential dangers.
Modernization Tools
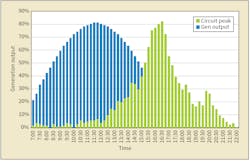
The increase in both type and quantity of DERs in SCE’s territory will have major consequences, many of which are still not understood very well. But even the effects of PV, which were anticipated at least since the coining of the term “duck curve” more than a decade ago, make a compelling case for why grid modernization has become an SCE priority.
Utilities have begun to explore the potential for combinations of DERs as alternatives to traditional wire solutions, such as PV paired with energy storage. This type of consideration requires system planning tools to assess the viability and dependability of a diverse DER portfolio. Can a portfolio of DERs be as dependable as, say, upgrading substation transformer banks or replacing a small conductor with a larger capacity conductor?
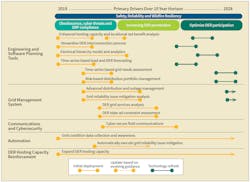
Dozens of tools are part of SCE’s grid modernization ecosystem, and they fall into one of three categories. The first category is foundational solutions, which are necessary precursors to the development of other grid modernization tools. A key example is SCE’s Grid Connectivity Model (GCM), which provides a topology of the utility’s entire electric grid in near-real time, enabling a variety of capabilities that are critical to other tools in the ecosystem.
The second category is external solutions, which gather information from and disseminate to sources outside of SCE. Examples include the utility’s Grid Interconnection Processing Tool (GIPT), which automates and digitizes the interconnection application process for new generation, and the DRP External Portal (DRPEP), which makes identified deferral opportunities available for public consumption in addition to distribution grid capacity availability, known as integration capacity analysis (ICA).
Lastly, SCE has system planning solutions, which represent the analytical and management tools that enable it to upgrade and optimize its system planning process. Key tools in this category are as follows:
- Grid Analytics Application, which performs analytics on large data sources, including the capability to cleanse electrical network field measurement data, such as supervisory control and data acquisition data, to develop load profiles for use in other systems.
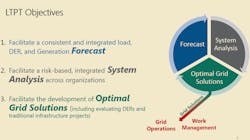
- LTPT, the utility’s central planning tool.
Before and After LTPT
Among the myriad tools associated with grid modernization, the econometric and time-series forecasting capabilities of LTPT play a particularly critical role and have been SCE’s primary focus during initial development efforts. For one, the forecasting capabilities are a major link among other LTPT components, relying on the outputs from some tools and generating key inputs for others. In addition, while many of LTPT’s components essentially are new functionality, the forecasting is a replacement for SCE’s historical approach, representing a dramatic transition from peak planning to profile planning methodologies.
Prior to LTPT, SCE’s planning methodology focused on load during the annual peak for every asset (roughly 5500 A-bank transformers, substations and circuits) in its system. The main objective of planning was to identify assets where the forecasted load in this single peak hour exceeded the capacity limits of existing equipment. While the method did disaggregate the peak hour into its various sources of load — base consumption, DERs and load-growth projects (LGPs) — the timing of the peak was assumed to be consistent year over year. In other words, an asset that peaked at 4 p.m. on a weekday in September in the base year was assumed to peak at the same hour on the same type of day throughout the forecast horizon. In addition to being highly manual and labor intensive, the output of this method was insufficient for many of the other LTPT modules, which employ sophisticated optimization routines/algorithms that require more granular and temporally diverse inputs.
In contrast, the econometric and time-series forecasting capabilities developed for LTPT’s profile planning methodology — which are highly automated, enabling distribution engineers to spend time on more value-added activities — provides four additional elements fundamental to achieving SCE’s grid modernization objectives:
- Frequency of violations. An engineer or analyst not only knows if a capacity violation occurs in the peak hour but also whether violations occur in other hours throughout the year.
- Duration of violations. Planners not only know a capacity violation occurs in the peak hour of, say, 4 p.m. but also that it actually started at 3 p.m. and lasted until 6 p.m.
- Peak shifting captured. Peak shifting can occur as a result of the growing influence of different DERs.
- Annual energy in addition to peak. This can reveal the value for resources that have benefits less related to peak load.
Knowledge of these seemingly subtle details gives SCE a quite different and more accurate answer about the optimal solution for a distribution constraint compared to the utility’s previous peak methodology.
LTPT’s econometric and time-series forecasting capabilities are based on several components, including long-term monthly energy forecasts where usage is modeled as a function of economic drivers, weather and calendar effects; hourly demand models that estimate load profiles as a function of weather and calendar effects; and extrapolation of DER and LGP forecasts to the hourly level using a variety of load profiles. The final output is a 10-year forecast of hourly load, disaggregated by source for every asset in SCE’s service territory.
Value of Profile Planning
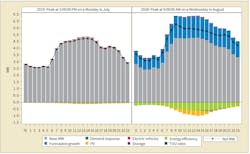
Looking at hourly profiles for one circuit on the day of the peak hour in the first and final years of a forecast horizon shows the value of profile planning. The hourly series are disaggregated into the source of the load, differentiating among base load, forecasted load growth based on the econometric model and the influence of various DERs. In the first year of the forecast, the peak — based on net consumption — occurs at 2 p.m. on a weekday in July. The effects of DERs are minimal, with only a small amount of energy efficiency lowering the peak. In the final year of the forecast, while the forecasted load growth from the econometric model is substantial, it mirrors the profile of the base consumption, so it has no effect on the timing of the peak.
However, the forecasted growth of DERs, primarily PV and energy efficiency, have a much more substantial effect, reducing the midday load so the peak now occurs at 9 a.m. The effects of LGPs are more pronounced, where the addition of substantial commercial load to a mostly residential circuit, or vice versa, also can affect when the peak occurs. The permutations of how LGPs and DERs can influence peak timing are many and have significant implications in how to assess a substation’s or circuit’s needs.
While impressive in terms of the volume and granularity of data, the LTPT relies on a variety of standard analytical methods common to load forecasting, load research and other utility practice areas. In isolation, the analytical methods are limited in terms of innovative features. Combined, however, the estimation of dozens of monthly and hourly models for more than 5000 assets represents an unprecedented scale and scope associated with the tool’s functionality.
Added to this are capabilities to automate the selection of intuitive and defensible model specifications that greatly reduce the hours required by distribution engineers and analysts. While most forecasting tools have automated selection based on some user-specified indicator of fit, the routine developed for LTPT considers the individual parameter estimates (like an economic driver should be positive) and incorporates several other data sources to ensure the defensibility of the champion model. For example, load research data is incorporated into the analysis to ensure an industrial economic driver is not selected for a circuit that is more than 90% residential. Also, in contrast to the previous planning method, LTPT allows for scenario analysis, enabling SCE to consider alternative economic, weather or DER forecasts.
LTPT Lessons Learned
Given the scale and scope of the econometric and time-series forecasting module, the development of LTPT came with an ample number of challenges and lessons that should have value to other utilities embarking on their own grid modernization journey.
First, the development of LTPT illustrated it is highly unlikely any single existing application can satisfy all the requirements needed for time-series forecasting. Forecasting applications can do some elements very well — individual forecasting models, for example — but efforts to extract every required element from a single tool likely will result in a substandard product that does not meet the true requirements. The key is to identify the correct tools for each individual requirement and develop a framework that integrates them efficiently.
Second, LTPT’s development showed the importance of involving the right people. Including distribution engineers, economists, load researchers, developers and IT was essential to building a tool that generated the correct output. No single group would have had the variety of expertise necessary to ensure the successful marriage of data and methodology. It became clear early on in the development of the tool these groups needed to be assembled in a collaborative environment to accurately and efficiently communicate the data requirements and desired functionality.
Third, transparency should be a priority throughout the development process. From internal staff to regulators, the credibility of the final disaggregated forecasts depends largely on the ability of reviewers to understand the methodology and data. Clear documentation and the avoidance of black-box analytics can help to get buy-in from key stakeholders. SCE worked in partnership with neighboring California investor-owned utilities (IOUs) and the California Public Utilities Commission (CPUC) to prioritize transparency in the system planning process, including the integration of external forecasts, forecasted grid needs and identification of potential deferral opportunities with DERs. What was once an internal analysis and approval is exposed externally now with the proliferation of new DER technologies penetrating across each IOU’s service territory.
Finally, it was important to foster an environment of ownership among the many people who contribute data to LTPT. In the end, any forecasting methodology is susceptible to garbage in, garbage out. Consequently, the quality of the forecasts and their value to the overall LTPT ecosystem depend on a high level of commitment from all those who provide data inputs.
Solid Foundation
At the time of this article’s publication, the econometric and time-series forecasting module of LTPT is operational, generating unprecedented quantities of data to support SCE’s distribution system planning activities. That said, the tool is still in its infancy. From the quality of the data it consumes to the analytical methods it employs, the application is going to improve substantially over time.
Despite this relative immaturity, LTPT represents a solid foundation on which SCE can improve and expand. Going forward it should prove to be a tremendous asset to SCE in its efforts to achieve its long-term vision for grid modernization. Future LTPT capabilities are to analyze the time-series forecast to include model-based circuit segment capacity analysis and project portfolio management, where each module continues to enhance the system planning process. Many of the approaches and lessons learned by SCE can provide a significant head start to other utilities when the time comes to better integrate DERs into their distribution planning.
Everett Aragon ([email protected]) is a senior engineering manager at Southern California Edison (SCE). He served on the project management team that led the Long-Term Planning Tool effort at SCE.
Collin Elliot ([email protected]) is a senior consultant with Corios LLC. He served on the project management team that led the Long-Term Planning Tool effort at Southern California Edison.
For More Information:
Corios LLC | coriosgroup.com
DER Challenge
The output of solar generation often has some overlap with the circuit peak load. Ideally, the grid should make use of the available generation from the distributed energy resource (DER), but it also needs to ensure other generation resources are available to accommodate peak customer demand. This example makes a straightforward case for how DERs represent a challenge. In reality, many other technologies are in the mix, and the acceleration of factors like the market, state policies and new technologies is increasing the complexity and difficulty of planning and operating grid infrastructure.
About the Author
Everett Aragon
Everett Aragon ([email protected]) is a senior engineering manager at Southern California Edison (SCE). He served on the project management team that led the Long-Term Planning Tool effort at SCE.
Collin Elliot
Collin Elliot ([email protected]) is a senior consultant with Corios LLC. He served on the project management team that led the Long-Term Planning Tool effort at Southern California Edison.


