Abstract -Gone are the days of dedicated live view video screens that are manually monitored by personnel. Advances in communications and software technology allow utility operators to be alerted of events captured by these cameras as they happen. While physical security applications have seen the most adoption of these video technologies within electric substations, visual and thermal monitoring can be automated to run in a continuous manner to improve the reliability of the substation operation and provide the data for Condition Based Maintenance.
Real-time alerts and alarms within a substation, an impending equipment failure and other operational events can be directly sent to an operator or dispatcher. Continuous thermal monitoring automates the manual “hand-held thermal scan” process that many utilities currently practice. Utilizing thermal cameras systems with sophisticated video analytics algorithms for anomaly detection can trigger automated alarms of possible issues directly to an operator who can make an informed operational decision.
I. Introduction
Automated video systems provide utilities with real-time visualization of the substation allowing them to make key decisions designed to prevent outages, save time and reduce costs. Substation video systems use sophisticated multifunctional sensors in conjunction with video and thermal analytics to provide real-time information for input into substation maintenance and operations programs. Using the latest technology in video automation, these systems monitor key points in the substation providing visual and thermal imaging that ties into the utility visualization and operation system (e.g. SCADA). Operators are provided real-time visualization of the substation assets and are automatically notified when normal operating conditions are not being met.
II. Visual and Thermal Monitoring Systems for Substation Automation
Substation monitoring systems differ from conventional video systems in function and application. A substation monitoring system is designed to give utilities a real-time view of the operational status of high value assets at remote substations from both the visual and thermal perspective. This differs from the conventional video system that is focused on physical security. A substation monitoring system can provide both operational and security functions [1].
The data obtained from video and thermal sensors deployed throughout the substation is processed by an analytics engine in a device located on premise at the substation. This system monitors the condition on site and determines if an alert should be sent to the operations and control center. A typical substation can have several video and thermal sensors deployed and it is not possible for operators to constantly monitor them all, especially when multiple substations are involved.
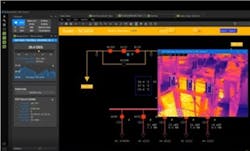
Traditional video systems require continuous manual human monitoring of a live stream of video. In contrast, video and thermal analytics automate the monitoring process and provide the alerts directly to utility operational software systems, such as SCADA. From SCADA, operators can open the alert message and view a snap-shot of the event and open a real-time live video feed of the substation (Figure 1). All the video and alerts are recorded on device located at the substation for review and archiving. This distributed nature provides extra reliability in that loss of network connectivity does not compromise the monitoring system.
I. Visual Monitoring and Analytics
Visual monitoring has benefits in that many operational, maintenance and safety applications in a substation can be done without sending a crew to the site:
Operational/Maintenance:
- Confirmation of remote-controlled operations such as switch opening/closing
- Detection of animals around lines, switches, transformers
- Site situation awareness
Safety:
- Ensuring safe conditions for the public and work crews at remote sites
- Witness and record that proper operational procedures are followed
- Intrusion detection, tampering, vandalism
To use the input from video cameras installed in all substations for the tasks mentioned above, constant monitoring is required. However, simultaneously monitoring the video channels from all substation is an impossible task for one human operator. Here is where the use of video analytics becomes crucial.
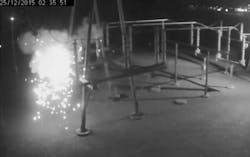
Video analytics have been used for security video systems for many years. Most of these analytics utilize algorithms that subtract the picture background from a video feed then analyze the shape and behavior of the objects left in the foreground. All these techniques have been mostly used to create video analytics routines for security purposes (e.g. motion detection, virtual tripwires, loitering alarms, etc.) [2], however, using the same concepts and algorithms, analytics can be manipulated to perform functions that are specific to electric power applications. For example, a fire or explosion can be detected with this type of analytics (Figure 2).
II. Thermal Monitoring and Analytics
Infrared thermographic inspection has played a key role in maintenance plans in electrical utilities due to its non-invasiveness, safety and relatively low-cost approach [3]. This technology detects and measures infrared radiation coming from objects in the field of view of the infrared camera and turns it into a visual image that represents the temperature of the objects. Traditionally, infrared thermographic inspections are done by technical experts using handheld infrared cameras targeting specific components in a substation like transformers, breakers, capacitor banks, control cabinets, cable joints and insulation, etc. The inspection is a thermal snapshot in time and often the detection of a problem requires technician to be at the right place at the right time as the load and conditions change throughout the day.
Due to the manual and time-consuming nature of the inspection, it is very common to have several months pass between two consecutive thermal inspections at a same site. The prolonged period between manual thermal inspections makes it less practical for real preventive and predictive maintenance. Furthermore, some issues can arise very quickly in an electrical substation causing considerable damage before a scheduled inspection takes place. In contrast, permanent fully automated thermal monitoring systems that can run continuously can detect issues quickly and support a preventive and predictive maintenance plan in a substation. Furthermore, mounting the infrared camera on a pan/tilt module allows inspection of multiple components in a substation with just a single camera reducing deployment cost significantly.
Every component or equipment in a substation has a normal temperature range of operation. For example, components in the path of an electric current will dissipate power in the form of heat proportional to its resistance of the current. Electromagnetic induction generates heat in the core of a transformer which is usually dissipated with radiator fins via a cooling system. Insulators on the other hand are not in the path of the current, so they should be close to ambient temperature if they are in a good condition. Understanding the temperature behavior of critical components in the substation is crucial to establishing the targets for an automated thermal inspection system: It is not always about finding the hot spot, but rather looking for thermal anomalies.
Here are some examples of situations with critical components in a substation that can be detected using Infrared cameras:
a. Transformers: Electromagnetic induction generates heat in the core of a transformer so a working temperature higher than ambient is normally expected on the body of a transformer. However, defects in the structure can create hot spots in unusual places around the body of the transformer indicating issues. Other components around transformer can also have unusual temperature behavior as well. Here are some issues that can be detected using infrared camera on and around a transformer:
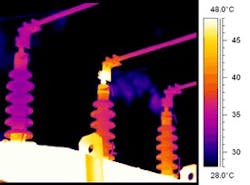
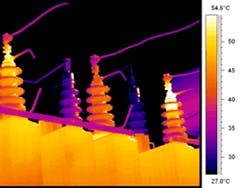
- Primary and secondary bushing connections: Loose or dirty connections, unbalance and overloading problems can cause overheating in the connections (Figure 3). The connection with the problem will be hotter than the connections of the other phases.
Figure 3. Transformer showing center primary side bushing with external connection problem [4]
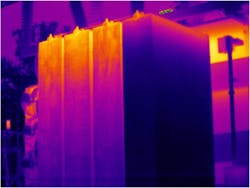
- Cooling fins: Cooling fins normally appear warm as they dissipate the heat generated in the core and windings of a transformer. If it is seen that one or more fins have lower temperature than the other fins (Figure 4.), then it can be concluded that the circulation of oil is being limited in those fins, possibly due to low oil level, flow obstruction, a closed valve, or perhaps the apparatus is out of level [5,6]. An automated thermal system can detect an increment of the delta temperature between fins.
Figure 4. Transformer showing a problem with a cooling fin [6].
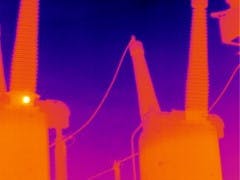
- Internal problems in bushings: A study found that, out of all the problems that a transformer can have, bushing failures are the ones that most often lead to fire in a substation [7]. Thermal imaging can show internal defects or connection problems in the bushing (Figure 5). It is important to remember that the temperature inside the bushing will be much higher than surface temperature detected by the camera.
Figure 5. Transformer showing left and right primary side bushings with internal problems [8].
b. Circuit breakers: Several different problems with circuit breakers can be detected by using infrared camera (Figure 6). Like transformers, a faulty or dirty connection between bushing and conductor cable or a bushing with structural damages will overheat during operation, which can be detected with an infrared camera.
Figure 6. Circuit breaker with a problem on the test tap cone [8]
III. Methods of Thermal Measurement
There are two common ways to assess the thermal condition of components in a substation. One is quantitative, where the objective is to get a fairly accurate temperature of the component. The other way is qualitative, where the goal is to find difference in temperature between components that should have a similar temperature [3]. Each technique has pros and cons and should be used depending on the type of automation process that is required. A good infrared camera system should provide tools to use both methods.
a- Quantitative method
In this method, the temperature readings from the infrared camera are used as the real temperature of the component. This temperature reading can then be compared to a threshold set by the component manufacturer for normal operation and trigger alarms when the temperature passes that threshold.
The problem with this method is the factors intrinsic to the component in which temperature is being measured (i.e. emissivity, size and distance from the camera), as well as extrinsic factors (i.e. ambient temperature, humidity, rain, wind velocity and background radiation) affects the infrared radiation reaching the camera [9]. All these factors should be taken into account when the temperature reading is calculated to have a valid useful temperature value. Factors related to the component can be provided by the manufacturer or measured directly in the substation. Some electrical substations have weather stations that can be used to provide the required environmental inputs to the thermal system. However, most of the times these factors are unknown in outdoor settings and can change greatly throughout the day. This is when the qualitative method should be used.
b- Qualitative method
In this method the temperature readings from two components, whose difference in temperature or delta temperature (∆T) is compared. If the ∆T obtained from the measurements is different than the expected ∆T then an alarm is triggered. For this method to work, the components that are being compared should be of the same material and be at a similar distance from the infrared camera. As both components are affected by the same factors, we can still obtain an accurate measurement of the ∆T between the two components.
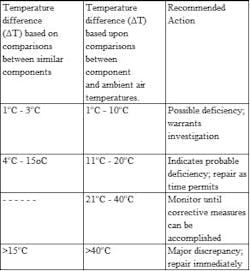
This is a great method to detect problems in the substation due to the electrical system being a balanced three phase power. In a balanced three phase power system, the components on each phase are identical material and should have the same electrical load. Therefore, they should also have same temperature profile. As such by comparing relative temperature difference between phases, one can easily determine the faulty component, if one of the component temperatures differs greatly from the others. For example, the International Electrical Testing Association, NETA, has created a table based on ∆T to guide actions.
Table 1. Suggested Actions Based on Temperature Rise [14]
IV. Visual and Thermal Monitoring on Industrial Process Networks
IP networks are commonly deployed in substations and other industrial applications to connect Intelligent Electronic Devices (IEDs), Remote Terminal Units (RTUs), and other protection and control equipment to each other and to the SCADA system [10,11]. Substation automation networks are industrial, process based networks that run critical applications to keep substation equipment and the power system protected and running safely [12]. Process based communications is machine to machine, thus uninterrupted and timely delivery of data is critical to keeping processes running correctly. Process based networks must therefore be kept isolated from the Internet and other corporate traffic to ensure that the data flow is secure and free of losses. In an IP network, technologies such as Virtual Private Networks, (VPNs), subnets and firewalls are used to keep the substation network isolated from the rest of the corporate LAN [13].
The video monitoring system is connected on the substation network so that it can communicate with the SCADA system at the control center. The video monitoring system can deliver alarms, messages, visual and thermal information regarding the conditions at the substation. This information can be fed into the control system for automated responses or for operators to make decisions and take actions. Since the substation network requires access privileges, the video and SCADA systems are not normally accessible to personnel without proper authorization.
V. Visualization in SCADA Systems
Representation of an electric power system traditionally consists of a one-line diagram that shows essential information such as current and voltage levels, switch status etc. in a two-dimensional map. The information is real time and shown on the Human Machine Interface (HMI) of the utility SCADA system. Integrating a video system with SCADA adds another dimension of real time visualization critical in ensuring more informed operational decisions. This will minimize outage times when unavoidable, while also providing trending analysis input to prevent outages and prolong the life of high value assets.
While a SCADA or OMS/DMS system can provide critical information on the status of the system such as a breaker trip and power outage, visual and thermal video information can provide confirmation of the cause of the event and enhance real time situational awareness. Visual and thermal video may be able to provide insights as to why the breaker operated? What is happening now at the remote site? Is a power line down? Is there a fire or leakage? With this information, the utility can safely and securely reduce the outage time by having knowledge of the problem before rolling the truck and sending personnel into the area.
More importantly, visual and thermal information can reveal system inefficiencies by finding thermal anomalies in the system so the utility can make repairs before the failure occurs. Transformer losses, voltage drops and load imbalances can be caused by leakage current in insulators or high resistance connections in power system components. These components will often show increased temperature that can be detected by infrared cameras. Continuous thermal monitoring will provide real time alerts and trending data as the system goes through load cycles allowing the utility to perform condition based maintenance on the system before failures and outages occur.
VI. Conclusion
Utilities are faced with the challenge of maintaining/improving service reliability without increasing costs. Video automation can remotely predict failures before they happen and detect and diagnose problems when they do. Video analytics automate the monitoring process to minimize the workload on operators and provide visual confirmation of the conditions at the substation. Through (1) automated remote visual inspections that reduce the number of trips to remote sites and (2) continuous thermal monitoring that analyzes the operating temperature of components in the power system driving condition based maintenance activities, automated visual and thermal monitoring can enable more efficient electric utility operations.
Sponsored by:
VII. References
[1] E. Sotter, G.P. Porciello and J. McClean, Video monitoring solutions for electric utilities: Issues, requirements and examples, Electric Energy T&D Magazine, Jan-Feb, 1 (17) (2013) p.39-43
[2] S. Velastin, CCTV video analytics: Recent advances and limitations, Lecture notes in computer science, Vol 5857 (2009) p.22-34
[3] M. Jadin and S. Taib, Recent progress in diagnosing the reliability of electrical equipment by using infrared thermography, Infrared Physics & Technology 55 (2012) p236–245
[4] S. James, Common thermography uses and applications within the petrochemical, offshore oil and gas, chemical, and power generation industries. http://www.irinfo.org/02-01-2009-james/
[5] A. Huda and S. Taib, Application of infrared thermography for predictive/preventive maintenance of thermal defect in electrical equipment, Applied Thermal Engineering 61 (2013) p220-227
[6] Transformer cooling tubes, Thermal Imaging Blog. http://thermal-imaging-blog.com.
[7] F. Vahidi and S. Tenbohlen, Statistical failure analysis of european substation transformers, ETG-Fb. 144: Diagnostik elektrischer Betriebsmittel 2014, p.5-9
[8] M. Ralph, Power plant thermography–wide range of applications, Inframation 2004, Proceedings vol. 5, p241-258
[9] L. Dos Santos, Infrared thermography applied for outdoor power substations, Thermosense XXX Proc. of SPIE Vol. 6939, 69390R, (2008)
[10] K.H Mak and B. Holland, Migrating electrical power network SCADA system to TCP/IP and Ethernet netwroking, Power Engineering Journal, 16(6) (2002) p.305-311
[11] C. Wester and M. Adamiak, Practical applications of Ethernet in substations and industrial facilities, Conference Record of Annual Pulp and Paper Industry Technical Conference, (2011) p.55-66
[12] C. Hoga, New Ethernet technologies for substation automation, 2007 IEEE Lausanne Powertech, Vols 1-5 (2007) p.707-712
[13] S. Wu, C. Kiu and A. Stefanov, Distributed specification-based firewalls for power grid substations, IEEE PES Innovative Smart Grid Technologies Conference Europe (2014)
[14] Don A. Genutis, Infrared Inspections and Applications, Neta World Winter 2006-2007

