In Part 1 of this series we defined a wide area blackout as an event in which part of the electric power transmission system collapses, interrupting the flow of electric power to 250,000 customers or more. Though rare, once every 10 years, wide area blackouts have costly impacts. To create a reliable electric grid for years to come, a reasonable goal is to decrease the occurrence of wide area blackouts to once every 100 years.
However, wide area blackouts will become more frequent unless electric utilities and their partners embrace change. This is especially true as renewable energy becomes a key source of electric power, electric vehicles become the workhorse of the transportation industry, and smart appliances become commonplace. Although it is difficult to predict when and where the next wide area blackout will occur, the conditions that lead to wide area blackouts are well understood. Let’s take a closer look at these conditions, as well as important considerations when a fault occurs and after a fault is cleared.
Event TriggersThe most likely triggers of a wide area blackout are three phase faults on transmission facilities and near simultaneous loss of multiple energy sources.
When three phase faults occur, power transfer from energy sources to customer loads is momentarily degraded or interrupted. This causes fan and pump motors to slow down and air conditioner motors to stall. Then, when the fault is cleared, many motors begin to simultaneously reaccelerate. At this time, electric utilities do not install protective relaying schemes that actuate to mitigate fault induced precursors to wide area blackouts.
When multiple energy sources are simultaneously lost, frequency drops as customer load exceeds the remaining energy supplies. When frequency drops below 57 Hz, large steam turbines will be damaged. The weak links are the longest blades in the low pressure stage. At this time, electric utilities install protective relaying schemes to shed load when frequency drops below 59.2 Hz and to trip generators when frequency drops below 57.6 Hz. However, under frequency load shedding is ineffective during fault induced precursors.
The Uphill ClimbThe electric power grid can be compared to a fully loaded, ten wheel dump truck going uphill at 60 mph. The instant that the driver lifts his foot off the gas pedal, the truck slows down. Reacceleration is problematic. The conceptual difference is that the electric power grid is always climbing “uphill.” Sometimes the slope is less than 1%, sometimes the slope is more than 25%, but the slope is always in an upwards direction. Even when load is ramping down, the power system is still continuing an uphill climb.
Routine changes in customer load are ramp-like changes, as illustrated in Figure 1, for spring, summer, fall, and winter conditions. The figure shows typical daily load profiles for over a 24 hour period. During a typical summer day, between the hours of 5:00 am to 11:00 am, the amount of power being demanded is increasing continuously, as a ramp increases in height, rather than in large chunks, like steps.
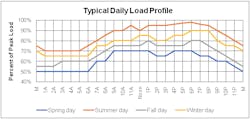
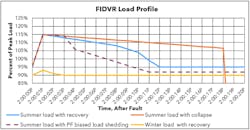
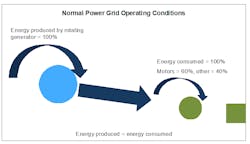
Figure 3 shows a visualization of power transfer. One hundred percent of energy produced by rotating generators is consumed by motors and other devices, and the electric power grid is balanced. As energy demand “ramps up” each day, energy production is increased to match the demand. One keynote is that the rotational speed of motors lags behind the rotational speed of energy producers by a few percent.
When faults or short circuits occur, the link between energy sources and energy consumers is distorted, and the amount of energy delivered to consumers is reduced. This is illustrated in Figure 4. The result is that rotating energy sources (traditional generators) start accelerating, while motors start decelerating.
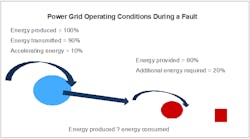
Wide area blackout analysis focuses on three phase fault conditions, because when a three phase fault occurs, the entire power grid is disturbed.
During fault conditions, generators accelerate because input power is unchanged while output power is reduced. The difference between input energy and output energy becomes accelerating energy. Motors start decelerating because input power is reduced while shaft power remains unchanged.
When a Fault Occurs: Important Considerations
Fault duration is an important consideration at this point. The power grid operates at 3600 RPM while motors operate at various speeds: 3600 RPM, 1800 RPM, and 1200 RPM. The important point is that most faults are cleared in less than 100 milliseconds. This corresponds to 6 revolutions of a 3600 RPM motor, 3 revolutions of an 1800 RPM motor, and 2 revolutions of a 1200 RPM motor. The possibility of motor stall during fault conditions increases as motor speed increases, as fault duration increases and as motor voltage decreases
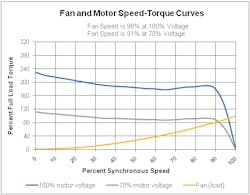
The next consideration is motor application. Pump and fan motors slow down when input power is reduced. The intersection of the motor torque curve with the fan or pump curve transitions to a new operating point, as illustrated in Figure 5. Compressors and other high torque motors stall when input power is reduced.
After the Fault
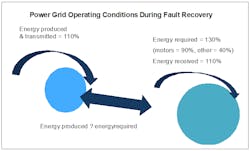
The electrical grid must recover quickly, within 10 seconds, or auxiliary systems in energy production facilities will become unstable, leading to grid collapse. This phenomenon is illustrated in Figure 2 ateighteen seconds after a fault is cleared.
A detailed analysis of the recovery window is key to preventing wide area blackouts. Energy providers need to provide detailed, seasonal, time sensitive models that include real power output (KW), excitation energy output (KVAR), VAR limits, and machine inertia to transmission system operators. Electric utilities need to provide detailed system diagrams that include seasonal customer load and renewable energy sources at each substation. Seasonal customer loads need to be categorized as: resistive, constant power, general purpose motors, and high torque motors. Renewable energy sources need to be categorized as machine-based sources or power electronics-based sources.
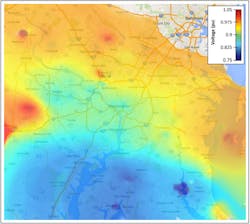
Transmission system operators need to develop seasonal, bifurcated FIDVR models to determine whether grid collapse is likely when a three phase fault occurs. Figure 7 is a representation of grid voltage from NERC’s assessment of the Washington, D.C., Area Low-Voltage Disturbance Event of April 7, 2015. This shows that voltage in Washington, D.C., was 82% of nominal when a fault occurred at a location that was 30 miles away.
Figure 7 shows a recoverable FIDVR event that can be analyzed using traditional load flow analysis methodology. If grid voltage drops to less than 75% of nominal, bifurcated, dynamic system modelling is needed.
To perform an analysis of a triggering event that may lead to a wide area blackout, the following steps are key:
1. Develop wide area voltage profiles, similar to Figure 7, for faults at locations in the electric power grid.
2. Assign fault clearing times, 100 milliseconds for normal fault clearing, 250 milliseconds for stuck circuit breaker clearing.
3. Estimate the percentage of fans and pumps that:
- Trip offline because of the fault induced voltage dip.
- Slow down because of the fault induced voltage dip.
- Reaccelerate when voltage recovers.
4. Estimate the percentage of high torque loads that:
- Trip offline because of the fault induced voltage dip.
- Stall because of the fault induced voltage dip.
- Reaccelerate when voltage recovers.
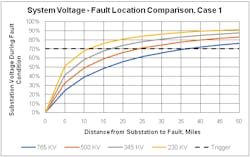
As the nominal transmission voltage increases, risk increases due to that fact that the impedance of all overhead transmission lines is nearly the same on a per mile basis. System voltage as a function of fault location is shown in Figure 8 for a system that has one transmission line between substations. The significance of Figure 8 is: at 765 KV, faults that are within 35 miles of a substation can become triggering events; and at 230 KV, faults need to be within 10 miles of a substation to become a triggering event.
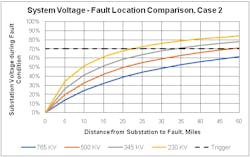
The significance of Figure 9 is: at 765 KV, faults that are within 50 miles of a substation can become triggering events, while at 230 KV, faults need to be within 20 miles of a substation to become a triggering event.
In our next article in this series on wide area blackouts, we’ll talk about prevention strategies.
Tony Sleva, PE, LSM-IEEE is currently an adjunct instructor at the University of Wisconsin-Milwaukee, teaching continuing education courses for the power industry. He is also president of Prescient Transmission Systems. Tony has more than 50 years of professional experience as an engineering manager, electrical engineer, project manager, instructor, training program developer, forensic investigator, author, and research engineer. Tony’s T & D experience has included projects for Con Edison, Exelon, PECO, PEPCO, Atlantic City Electric, PPL, PacifiCorp, Alaska Railbelt, CTRL (Channel Tunnel Rail Link – England, France), and more. He has authored the textbook Protective Relay Principles. Connect with Tony on LinkedIn for more information.
About the Author
Tony Sleva
Tony Sleva, PE, LSM-IEEE is currently an adjunct instructor at the University of Wisconsin-Milwaukee, teaching continuing education courses for the power industry. He is also president of Prescient Transmission Systems. Tony has more than 50 years of professional experience as an engineering manager, electrical engineer, project manager, instructor, training program developer, forensic investigator, author, and research engineer. Tony’s T & D experience has included projects for Con Edison, Exelon, PECO, PEPCO, Atlantic City Electric, PPL, PacifiCorp, Alaska Railbelt, CTRL (Channel Tunnel Rail Link – England, France), and more. He has authored the textbook Protective Relay Principles. Connect with Tony on LinkedIn for more information.