International Trade Administration Launches Supply Chain Data Visualization Tool
In the world of electric utilities and grid operators, the international supply chain for electrical equipment and components has become increasingly important. Supply chain shortages have become a fact of life for electric power companies in the wake of the COVID-19 pandemic. Products like electricity meters and generators are in short supply due to a range of factors, including chip shortages and broader macroeconomic trends. In June 2021 the White House announced the creation of a Supply Chain Disruptions Task Force to look into the issue, and, in February 2022 the Department of Energy published its own set of reports highlighting critical inputs for securing America’s clean energy supply chain. Needless to say, the topic of supply chain is top of mind for many.
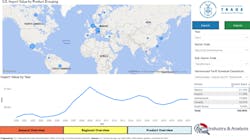
As U.S. utilities and asset managers look to make more informed integrated resource planning decisions, increasing awareness and transparency around the global supply chain for energy products is a must. The (ITA) has recently released the U.S. Energy Trade Dashboard, an intuitive, user-friendly data visualization tool that allows users to view U.S. trade data across eight sectors, more than 40 sub-sectors, and more than 500 unique energy products. The Dashboard is a public online resource that does not require user registration or fees; simply visit the website from your desktop or mobile device (desktop is preferable) to access the Power BI-based tool. Users can seamlessly toggle between export and import data over the last 20 years, helping to provide insight on U.S. commercial interests across the full range of energy industries around the globe as well as providing insights into imported products ending up on the U.S. grid. You can even download the underlying data to run your own analysis.
Within the “Electricity Infrastructure” sector of the Dashboard, users can find U.S. trade statistics for traditional transmission and distribution products like arresters, circuit breakers, transformers, switchgear, meters, and more. Products listed under the Electricity Infrastructure sector are delineated into 10 sub-sector codes, each containing a basket of products. For example, under the “Transformers” sub-sector code, users can find detailed statistics for 13 different transformers varieties based on KVA rating and insulator type. Users can view different distribution-level transformers ranging from 1KVA all the way to large power transformers exceeding 100,000KVA. By selecting the “Product Overview” view, users can find statistics at the individual product level, providing users with a significantly greater visibility into where imported products shipped outside of the United States are coming.
Data found through the Dashboard shows that, in 2021, the United States imported just under $6 billion in equipment within the Electricity Infrastructure sector. The greatest volume of U.S. Electricity Infrastructure imports—just under 60%—came from Mexico and Canada, who are Free Trade Agreement partners through the United States-Mexico-Canada Agreement (USMCA). This is reflective of the tightly integrated manufacturing supply chains for grid equipment in North America and common electricity market dynamics across the continent. The North American grid operates at 60 Hertz, compared with 50 Hertz across most of the rest of the world. North American utilities also more commonly employ equipment using industry standards by organizations like the National Electrical Manufacturers Association (NEMA), the Institute of Electrical and Electronics Engineering (IEEE), among others, compared with the International Electrotechnical Commission (IEC) standards that are more commonly used in other parts of the world. Finally, the close geographic proximity of Mexico and Canada means shorter transport logistics for equipment.
Drilling down into the sub-sector or product level, however, this dynamic can vary. Take the two individual products with the largest import values: large power transformers (LPTs) and electricity meters. LPTs were by far the highest imported product by dollar value in the Electricity Infrastructure sector. Liquid dielectric transformers above 100,000 KVA (HS 8504230080) imports accounted for more than $720 million in 2021. Imports from Mexico accounted for 21.13%, followed by Austria (17.18%), the Netherlands (15.09%), Canada (10.47%), South Korea (9.43 %), Brazil (9.33%), and 12 other countries accounting for the remaining value. Compare this to electricity meters (HS 9028300000); of the $497 million in imported meters, Mexico and Canada accounted for 92.24%and 4.14% of the value, while 38 countries accounted for the remaining 3.62%.
Anyone in the industry knows that LPTs and electricity meters are fundamentally different products, yet they are both essential to a functioning grid. For large power transformers, the backbone devices through which an estimated 90% of the nation’s electricity passes through, manufacturers require exceptional levels of technical skill, factory space, and specialty equipment to produce massive, custom-built products. Very little about the manufacturing process is automated, and virtually every unit is built to order. While close geographic proximity is an advantage, other factors such as access to skilled labor and material inputs play an important role.
For electricity meters, the critical devices at the grid edge used for measuring customer usage, the manufacturing process is very different. Original equipment manufacturers take full advantage of automation to mass produce meters by the thousands. Unlike the custom-built LPTs, electricity meters are built to physical dimension standards: in North America, the American National Standards Institute (ANSI) C12.20 standard specifies the outline and terminal dimensions of meters, which are typically round. This is different from most of the rest of the world, where the rectangular shape specified by the IEC 62052 standard is more commonly adopted. As a result, the demand for electricity meters in North America is almost entirely satisfied by North American supply.
Historically, grid operators have been more concerned with product performance than origin: as long as the device meets performance requirements then there is no problem. However, utilities are increasingly paying greater attention to where their products originate. The Department of Energy acknowledges in its Securing Critical Electric Infrastructure article that the growing prevalence of essential electric system equipment being sourced from China presents a significant threat to U.S. critical infrastructure. Increasing visibility into the supply chain for electrical equipment and components is essential, and the U.S. Energy Trade Dashboard is an additional tool for utilities and grid operators.
Visit the U.S. Energy Trade Dashboard at: https://www.trade.gov/us-energy-dashboard-and-industry-briefs
Andrew Moyseowicz is a Senior International Trade Specialist in the Office of Energy & Environmental Industries in the U.S. International Trade Administration, a federal agency within the Department of Commerce that strengthens the competitiveness of U.S. industry, promotes trade and investment, and ensures fair trade through rigorous enforcement of U.S. trade laws and agreements. He is responsible for devising and implementing international trade, investment, and export promotion strategies that strengthen the global competitiveness of the U.S. electric power sector. Mr. Moyseowicz holds a BA in Political Science and History from Emmanuel College and an MPA from Princeton University.
About the Author
Andrew Moyseowicz
Andrew Moyseowicz is a Senior International Trade Specialist in the Office of Energy & Environmental Industries in the U.S. International Trade Administration, a federal agency within the Department of Commerce that strengthens the competitiveness of U.S. industry, promotes trade and investment, and ensures fair trade through rigorous enforcement of U.S. trade laws and agreements. He is responsible for devising and implementing international trade, investment, and export promotion strategies that strengthen the global competitiveness of the U.S. electric power sector. Mr. Moyseowicz holds a BA in Political Science and History from Emmanuel College and an MPA from Princeton University.