From Big Data to Actionable Analytics

Imagine a world in which every piece of data has a job. New information is not simply logged into an endless abyss of forgotten databases but rather logically kept and actively used. Now, add in the ability for employees to access and manipulate the data easily using well-known applications (like Microsoft Office, Google Earth, and ESRI ArcGIS) to enable sustainable analysis, without having to rely on a central group of analysts. In this world, unexpected challenges are met with data-driven decisions daily and employee turnover does not result in the loss of information.
For many utilities, this world is not far off. For PECO Energy Co., a subsidiary of Exelon Corp., this world is here now as a result of the Exelon Utilities Analytics Academy. This program is aimed at enabling employees to adopt digital skills, such as machine learning, operational analytics, visual storytelling and automated analysis. This ensures the people who are most familiar with the meaning behind the data also can conduct their own analysis, rather than having to rely on a central group of analysts. Launched as a pilot in 2018, the program received overwhelming support and engagement from the business, which led to a full corporate-wide rollout in mid-2019.
Although the program has been in existence only since 2018, there has been a vast improvement already in the understanding and utilization of analytics in employees’ day-to-day jobs. Most recently, PECO experienced two successes in distribution automation (DA) work when employees fully leveraged rich performance data. Using tools such as Python, PowerBI and ArcGIS, PECO engineers were able to identify electric equipment issues successfully using radio frequency (RF) noise readings and prioritize maintenance by aggregating email alerts.
DA System
To fully appreciate the value of such analysis, it would be useful to take a step back and provide some context. PECO currently operates a point-to-multipoint RF system known as Sensus FlexNet. As part of its FlexNet deployment, the utility committed to move the communication for its DA devices, such as reclosers and remotely controlled capacitor banks, from traditional copper telecommunications circuits to the private wireless Sensus FlexNet platform. Presently, PECO operates more than 2500 devices on this system and actively is deploying additional devices. It expects to eclipse 3000 by the end of 2020.
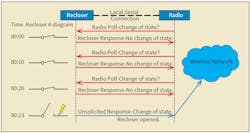
The Sensus FlexNet system is a report-by-exception-based system, meaning devices send messages back to PECO when they operate or certain operational parameters are exceeded. For instance, as timestamp 00:00 thru 00:30 in the diagram below indicate, if no significant changes occur at recloser A, no information will be sent across the RF network. Conversely, if recloser A opens in response to a fault event (timestamp 00:33), a message is immediately sent over the RF network reporting that breaker A is now in open status. This provides for the most efficient use of the RF network and ensures only pertinent data is stored. To maintain a sense of communication and connectivity, the devices also are configured to send regular heartbeat messages at set time intervals. While this ensures communication, the actual operational health of the device may not be known.
This information then is funneled into the head-end application for FlexNet DA, known as AutomationControl. This application is used daily by the smart grid services DA team for configuring, monitoring and troubleshooting communi-cations to all DA devices on the system. It enables the team to see the status of every device, set off-normal conditions for each point of interest (and trigger email alerts based on these conditions), run reports and graphical analysis, and much more.
Beyond these uses, PECO has leveraged the rich performance data to learn more intimately how the system is performing at a high level and on an individual device basis. This information has provided new insight and enabled PECO to operate with a heightened level of accuracy and efficiency. PECO has experienced two recent successes leveraging rich performance data:
- Using RF noise to detect electric equipment issues
- Aggregating email alerts in PowerBI for improved operational awareness.
Elevated Noise Levels
One of the primary responsibilities of PECO’s smart grid services DA team is to ensure optimal performance of the radio network by monitoring and troubleshooting conditions that may hinder radio communications. With FlexNet, PECO owns several proprietary frequencies near the industrial, scientific and medical (ISM) band and is tasked with safeguarding these frequencies from any conflicting sources.
When conflicts do arise, it is known as an RF exception. It is a day-to-day battle to identify and diagnose these RF exceptions, the causes of which can range from poor coverage to nearby interference and elevated noise. Many issues that involve noise and interference require an RF field investigation, using a spectrum analyzer and directional antenna in tandem to locate the specific source.
It is paramount for noise and interference issues to be mitigated in a timely manner, because control of the grid depends on the ability to continuously communicate to all devices. To accomplish this, the team developed techniques to monitor and detect noise anomalies at base stations throughout the PECO service territory. Using the newly acquired ability to code, thanks to the Exelon Utilities Analytics Academy, engineers created a Python script that evaluates base station noise data on a daily basis, creates normal operating envelopes for each site and flags any site that experiences a noise reading outside the allowable envelope.
Many times interference is caused by inadvertent settings or malfunction of external radios; however, it has become apparent the team can identify internal electric equipment issues causing broadband noise by evaluating the signature of the noise. Broadband noise can be caused by the ionization of air, which occurs as electricity arcs between a gap from conductor to conductor. Power line noise (PLN) is a well-documented phenomenon and can occur on arcing in overhead power lines or substation equipment.
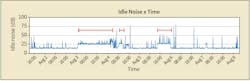
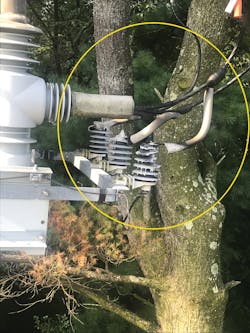
In a recent example, the team detected an elevated noise level of 12.5 dB on average at a base station colocated with a unit substation. It was noted both advanced metering infrastructure and DA frequencies were experiencing the noise. Therefore, it was concluded broadband noise was being generated from a piece of equipment within the substation. After investigation, a field crew found a high-voltage bushing that had failed, inducing arcing across the insulators. The team is looking now at the possibility of creating a script that will detect precursor spikes in noise, which may be indicative of possible future issues. As the saying goes, prevention is cheaper than a cure.
Operational Awareness
In addition to monitoring the network for noise, the team also tracks the myriad alarms generated by DA devices across the grid. Using the Sensus head-end software, AutomationControl, the team can configure email messaging (with custom verbiage in the body of the email) based on off-normal conditions occurring in the field. For example, if a command is sent to open a normally closed breaker, an alert is recorded in AutomationControl, which triggers an email to be sent to all applicable users to notify them the device has just changed states.
Normal operation of the grid can trigger thousands of these emails per day. Even with email rules in place, there simply is no easy way to parse any actionable information through the inbox onslaught. Some information is good, but too much is as good as none. So, how does one decipher between normal operation and a significant situation that warrants attention? The key is to monitor the amount of emails received rather than each individual email.
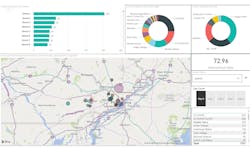
To do this, the team set up a data model in Microsoft Power Query that pulls information from a specific inbox and converts it into a tabular format. The bodies of the emails are parsed to extract information about the alert—for example, device name, location, alarm type and time of occurrence. The extracted information is linked to several different widgets on a PowerBI dashboard to display the amount of alarms per device, location, alarm type, control type and more.
Because the information is based in the Microsoft Outlook Exchange cloud server, the dashboard is programmed to refresh automatically every two hours. On top of this, automatic notifications are sent via email and smartphone to team members whenever the amount of alarms or trend of alarms exceeds specific thresholds.
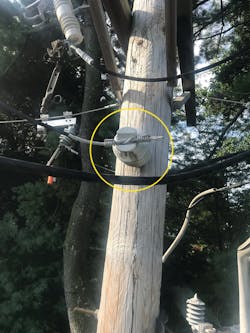
Recently, the dashboard proved its usefulness by alerting a team member to an alarming condition at a recloser following a storm. The recloser controller was toggling the alternating-current (AC) power on and off, generating thousands of emails. After investigation, it was noted the control’s battery backup was engaged. At this point, the recloser would have had 24 hr to 48 hr before monitoring and control functions were lost. After being alerted to the situation, a field crew went on-site to diagnose the issue. The crew identified the lightning arrester and transformer fuse had blown and confirmed the device had been struck by lightning.
Had this situation occurred in the past, this scenario might not have been investigated until the battery backup was depleted or the device was called to act.
Converging Intelligence
While both examples of success using rich performance data are useful in and of themselves, the real value of the distributed analysis and development approach only truly can be seen if users develop their analyses in common applications. Because the team performed the analyses in well-known Microsoft applications and relatively simple Python programs, users could pass on the results and applications to future groups without fear of losing information in the turnover process.
In using the same applications cross-company, there is a template effect where comprehension is greatly improved simply through the presentation of the data. In addition, once employees have the ability to create their own analytical conclusions and publish this information to the cloud, other users can draw from their conclusions, creating a network of converging intelligence without duplicating efforts. With the data model established and cross-departmental access provided, PECO anticipates substantial gains in system performance and operational awareness. For PECO, this is not only the age of big data but also the era of actionable analytics.
About the Author
Luke A. Benedict
Luke A. Benedict is an engineer in PECO Energy Co.’s smart grid distribution automation team, where he specializes in evaluating new technology to deploy on the distribution grid. He is especially interested in the data that can be collected from this new technology and the logical manipulation of data to improve grid performance. Most recently, Benedict aided in a pilot project to introduce the first smart inverter with remote communication to PECO’s system. Benedict holds a BSME degree from Drexel University and was previously a project engineer in PECO’s gas department.