Power Quality Monitoring Provides Additional Value
Many utilities have experienced how labor intensive it is to retrieve and compare power quality (PQ) data from numerous devices and systems, no matter the infrastructure in place. Delays and inefficiencies in data analysis impede the early detection and investigation of electricity system faults. In turn, these failures in productivity and performance gaps increase the risk of costly repairs, major asset replacements and prolonged network outages.
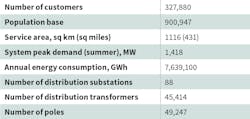
To mitigate these issues, the revenue metering program in Canada’s National Capital Region was expanded to include PQ monitoring in 2002. As a recently amalgamated utility with more than 300,000 residential and commercial customers in a service territory of 1116 sq km (431 sq miles), Hydro Ottawa Ltd. began to record long-term statistics on voltage sags and harmonic distortion at key distribution substations.
PQ Monitoring
In 2004, Hydro Ottawa installed PQView, a proprietary central PQ monitoring and analysis system. PQView integrates PQ-related disturbance and steady-state measurement data, site characteristics and event information generated from multiple monitors, relays, recorders and other instruments. Equipped with automated analytical and reporting tools, the system has been instrumental in helping Hydro Ottawa to better understand, predict and respond to all electricity events occurring on the distribution network.
Over a period of 10 years, Hydro Ottawa expanded its PQ system to more than 125 monitoring locations, including all 8.3-kV, 13.2-kV, 27.6-kV and 44-kV substation bus bars. Measuring bus voltage and current, these PQ monitors are installed on the secondary side of the substation transformer.
Most of the data is downloaded from the monitors to PQView using broadband communications (Ethernet) through the corporate network. Although some data is still being downloaded by modem, the PQ monitors remain accessible to other computers at Hydro Ottawa through fiber-optic wide-area-network connections.
Fault Location
In 2014, PQView was augmented with FaultPoint, an automatic fault location system (AFLS) module that identifies fault causes, problem conditions and fault locations with greater accuracy. Email notifications are issued by the control center, which — together with the estimated fault location maps that are available online within five minutes — enables Hydro Ottawa’s field crews to identify the fault location and repair equipment more quickly than previously possible.
The AFLS module incorporates the use of measurements from PQ monitors, distribution circuit models, SCADA operations, and Hydro Ottawa’s geographic information system (GIS). Measurements recorded at the distribution substations are downloaded automatically and incorporated into PQView. These measurements are then used to calculate the circuit reactance from the distribution substation to the fault. The calculations are based on phasor measurements derived from the voltage and current values. They also include calibration constants based on previous fault measurements and known locations.
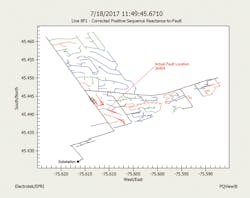
The result of these calculations is an estimated reactance to fault (XTF). The XTF values are compared to line models that estimate the positive-sequence and zero-sequence reactance between the distribution substation and circuit structures. The calculated fault locations then can be viewed using PQView’s web application (PQWeb), enabling the estimated locations to be displayed on single-line circuit diagrams overlaid on Esri or Microsoft maps.
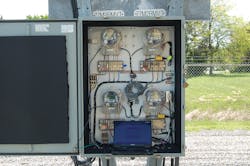
Most of the distribution substations on Hydro Ottawa’s distribution network are designed with four medium-voltage bus bars, each supplying four medium-voltage feeders. The bus bar voltage and current from each distribution transformer are monitored by a single Schneider Electric ION PQ and revenue meter.
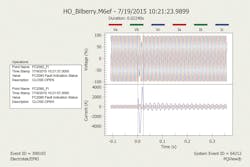
Measurements by the PQ monitors are triggered using high and low root-mean-square (rms) voltage thresholds. When a voltage sag is detected (less than 90% of nominal voltage) or voltage swell is detected (more than 110% of nominal voltage), the monitor is triggered to record samples of the voltage and current waveforms, including the rms.
These measurements are downloaded by PQView and passed through a fault characterizer, which looks for the signatures of permanent faults, incipient sub-cycle faults, magnetizing transformer inrush currents, phase imbalance and more. If a measurement shows a fault lasting more than one cycle (longer than 16.677 msec), then the estimated reactance values to the fault are derived from its waveform samples.
Hydro Ottawa’s PQ monitors are configured to record voltage and current waveform samples at a rate of 128 points per 60-Hz cycle, with typically five cycles of pre-trigger and 10 or more cycles of post-trigger data. The PQ monitors communicate with a server through a broadband Ethernet connection, so the fault measurements can be downloaded from the monitors to PQView within minutes.
Storing Circuit Models
The distribution network circuit models are stored in Eaton Industries CYMDIST databases, which are extracted from Hydro Ottawa’s GIS. These models provide the geospatial coordinates for the nodes that comprise the line segments of medium-voltage distribution feeders in a Lambert conformal conic projection system. The coordinates are converted to the World Geodetic System (WGS84) so maps can be displayed as overlays in standard GIS software systems.
The circuit models include the underground cable and overhead line conductor characteristics used in different circuit sections. They also include positive-sequence and zero-sequence impedance characteristics. The number of phases for each circuit section is stored as well as whether the medium-voltage feeder is an underground cable or overhead line conductor. In addition, the cumulative impedance for each underground cable and overhead line conductor section of each medium-voltage circuit is stored in the PQView database.
Integrating Data
Once the data is downloaded from the distribution substation, it only takes a few minutes for the waveforms and other data from the PQ monitors to be integrated automatically into PQView. The measurements can be queried from the PQView database and analyzed directly using workstation computer applications or indirectly through intranet web applications. For example, analysis of voltage characteristics and zero-sequence current characteristics may indicate a single-phase fault has occurred. Other line voltage characteristics can be examined that indicate a two-phase or three-phase fault has occurred. Harmonic content, waveform shape and event duration also are used to identify events, such as magnetizing current inrush events. Zero-sequence and negative-sequence current content is used to search for other overcurrent events that are not faults but otherwise noteworthy for automatic notification.
A single measurement may be classified as more than one type of fault. This means FaultPoint can identify single-phase faults that evolve into multiphase faults. For example, the system can identify the start and end of each stage of a fault that begins as a transformer energizing transient but degrades into a fault condition.
On the Hydro Ottawa intranet, several applications also can provide system operators and engineering teams with estimated fault locations, including the use of satellite imagery. Multiple estimated locations also are possible whenever a feeder is interconnected or has multiple branch paths.
Fault Circuit Indicators
As part of Hydro Ottawa’s network modernization, fault circuit indicators (FCIs) have been installed and polled by its SCADA system. The status of each FCI is stored in an OSIsoft PI System, which serves the role of SCADA historian.
As each fault measurement is downloaded, imported and identified, a query on the historian system is completed to determine if any circuit breaker positions or FCIs have changed status. If a status change is correlated with the fault recording, then there is more information to help pinpoint which feeder and feeder branch is the most likely location to have experienced the fault outage.
Distribution network operators use the estimated location of faults along with FCI data to assist in the interpretation of events that can occur on the network. This enables a prompt response in the mobilization of fault repair field crews to restore supplies quickly.
Early Detection
Since 2010, Hydro Ottawa has experienced six onload tap-changer failures on its power transformers. In all cases, final catastrophic failure of these tap-changers, and potentially the transformer, was averted through the detection of early equipment failure in PQView.
Although zero-current disturbances and high distortions in voltage and current waveforms were observed in some cases, Hydro Ottawa discovered voltage flicker was the predominant parameter used to predict tap-changer failures.
For enhanced vigilance to protect against this form of catastrophic failure, Hydro Ottawa plans to augment PQView with automatic microprocessor relay integration, outage management system integration and automated reporting for the International Electrotechnical Commission (IEC) and IEEE standards compliance.
Central PQ System Benefits
For Hydro Ottawa and other users of full-time PQ monitoring solutions, the ability to import time-sensitive power monitoring data from many sources and have it readily available in a central PQ monitoring and analytics system offers the following benefits:
- Protection for valuable assets. Finding and identifying the source of anomalies as quickly as possible provides a valuable insight in the understanding of, and response to, events on the distribution network. Well-integrated tools and systems can detect the imminent failure of capital intensive transformers, tap-changers and capacitor banks, enabling them to be taken out of service and repaired prior to catastrophic failure.
- Reduced outages and downtime. Eliminating the catastrophic failure of major components can reduce the number and frequency of outages. Timely access to event data can help the utility to pinpoint the location of faults quickly, reduce the time it takes to troubleshoot outages and improve restoration times.
- Optimized predictive maintenance. Being able to detect and investigate problems within minutes not only prevents damage but also reduces asset wear and tear as well as extends asset life cycles.
- Robust compliance. Monitoring PQ indices will enable both customers and energy providers to measure performance against industry standards, such as IEEE, IEC and CSA, and determine if remedial action is required.
- Ongoing customer service improvements. Full-time monitoring will capture most electrical events that can impact a customer’s supply. This enables system operators to respond swiftly by isolating the tap-changers from service.
- Electrical system awareness. Engineers and others will be more informed about events impacting customers, thereby reducing the time and resources required to improve service and reliability.
Summary
The proper integration of multiple databases and tools is key to a fully optimized, full-time power monitoring solution. It empowers utilities, generators and large users with better protection and control over the entire distribution network. The AFLS has proven to be dependable, resulting in improved asset reliability. The system has demonstrated tremendous value, being of benefit to the utility, especially when dealing with underground cable faults in busy city streets.
As system operators and operations engineers become more familiar with the AFLS, Hydro Ottawa can expect significant benefits. One benefit is a reduction in the time it takes to locate and repair faults, resulting in fewer operating and maintenance expenses. Another benefit is a reduction in outage duration, thereby reducing the customer average interruption frequency index.
Acknowledgement
The authors of this article wish to thank Gary Macleod of CPS – Current Power Services for all his support and the technical information he provided in the preparation of this article.
Mark Wojdan ([email protected]), P.E., is supervisor of engineering programs and major projects at Hydro Ottawa Ltd. His responsibilities have included implementing maintenance programs for the distribution system, capacity planning and running the distribution system through best practices in asset management. He holds BSEE and MSEE degrees from the University of Waterloo, Canada.
Daniel Sabin ([email protected]) is a principal engineer with Electrotek Concepts Inc. and a software architect for the PQView and FaultPoint software systems. He was Hydro Ottawa’s consultant for this project. Previously, he was a project manager and research engineer with the Electric Power Research Institute. Sabin holds a BSEE degree from Worcester Polytechnic Institute and a MSEE degree from Rensselaer Polytechnic Institute. He is a registered professional engineer, an IEEE Fellow, and the current chair of the Transmission & Distribution Committee of the IEEE Power & Energy Society.
Sidebar
Hydro Ottawa
Hydro Ottawa is the third largest distribution utility in Ontario, Canada, responsible for distributing electricity to customers in the city of Ottawa and the village of Casselman. The customer class is primarily residential and commercial, with some industrial load.
The utility has invested in smart grid devices, including automated reclosers, automated pad-mounted sectionalizers, automated switchgear, supervisory control and data acquisition, fault circuit indicators, smart residential metering, and integrated revenue and power quality monitors.
About the Author
Mark Wojdan
Supervisor
Mark Wojdan, P.E., is supervisor of engineering programs and major projects at Hydro Ottawa Ltd. His responsibilities have included implementing maintenance programs for the distribution system, capacity planning and running the distribution system through best practices in asset management. He holds BSEE and MSEE degrees from the University of Waterloo, Canada.


