At Alabama Power Co., access to a distribution supervisory control and data acquisition (DSCADA) system has been available to the distribution operator since 1991. DSCADA provides remote access to distribution substations and automated devices along the distribution circuits. This remote capability facilitates the operation of the electric distribution system.
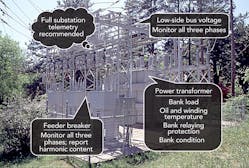
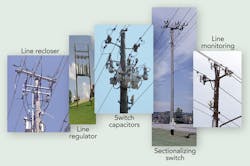
Today, the distribution operator has remote access to more than 4,400 automated distribution system devices including distribution substations, pole-mounted reclosers, gang-operated switches, regulators, distribution line monitoring sites and distribution switched capacitor sites. Smart distribution automation starts in the substation, and full substation telemetry is recommended. This automation extends to components of the distribution circuit. Each automated device provides full remote capability, which includes monitoring of the typical power measurements, fault detection and power quality.
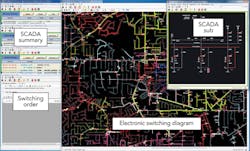
The switching diagram used to be a paper wallboard-based map. During the 1990s, while the operator was gaining increased access to remotely monitored and controlled field devices, all switching activity was manually documented on the wallboard-based map. In 2002, the utility began transitioning from the switching diagram to an electronic medium on the operator’s desktop workstation. While the switching diagram had been migrated to the desktop, the switching order was still being maintained on paper switching order forms. With the initial deployment of the integrated distribution management system (IDMS) in the control center in 2012, the paper switching order was transitioned to electronic format.
Seamless Integration
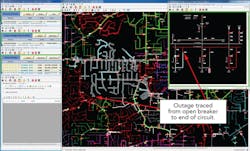
The IDMS provides a seamless integration of DSCADA and the electronic switching diagram (the official switching map). Geographic information system source data is imported to create the geographical switching map. The geographical displays are connected to the traditional substation schematic diagrams, which have been modified to enable connectivity within the schematic diagram. Thus, the operator now has the capability to trace connectivity from within the substation schematic to outside the substation, to the distribution feeder, to contiguous feeders at normally open switches and to the end of the line.
The operator now has a fully connected, operational model and map of the electric distribution system. All switching activity for capital as well as operations and maintenance projects is performed and maintained electronically. The daily log, as a variation of the switching order, provides the capability for recording and maintenance of the daily ad hoc switching activity performed throughout the operating day. With the deployment of IDMS to all five distribution control centers, the distribution operating personnel have the dynamic capability to back up each other, both within the control center and between control centers.
Operations Level of Complexity
The level of complexity associated with the daily management of a smart distribution grid warrants a new role within the distribution operations center (DOC). A new desk is proposed in the DOC for the purpose of leveraging near-real-time advanced applications to achieve optimal use of smart grid resources and assets, as well as to provide analytical support to traditional operations tasks of planned switching work and outage restoration.
The new DOC analyst will have fingertip access to advanced tools and applications to perform operations tasks that had been performed previously in the back office and sometimes on a seasonal basis. The role of the DOC analyst is to manage the efficiency of the distribution system while maintaining system voltage within regulatory limits and ensuring the delivery of electric energy.
Daily Switching Activity
The smart grid does not alleviate the daily switching activity. However, new presentation techniques can improve the visibility of the distribution system. While self-healing automation certainly can achieve faster restoration during unplanned outages, field crews still have to isolate and repair the root causes of the outages. And, in highly automated systems with distributed energy resources, the improved visibility supports safe field work so the DOC analyst complements the DOC desk. As the cause of the outage is isolated, the DOC analyst assists the area operator in restoring service and optimizing the full use of the available alternate distribution facilities. Volt/volt-ampere-reactive (volt/VAR) control techniques and conservation voltage reduction (CVR) can be applied to optimize the restoration of electric service while maintaining system parameters within acceptable regulatory limits.
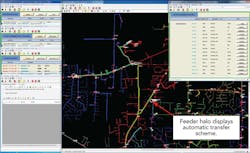
Automatic transfer switching schemes are being deployed along the distribution feeder. These schemes provide the frequently described self-healing capability of the smart grid. Thus, depending on the location of the system fault, these schemes will either restore service to the unfaulted sections of the distribution feeder or isolate the section if the fault is located within the transfer switching scheme.
Distribution System Efficiency
With at least two-thirds of grid technical losses occurring in the distribution system, there is adequate justification for a resource with responsibility for functions associated with loss minimization. The DOC analyst will manage the system losses during peak and valley conditions. This new system dynamic will increase the switching activity on a seasonal basis as well as a daily basis. The distribution system becomes a virtual power plant with the deployment of demand response and distributed energy producers.
For example, consider the system loading during peak conditions on a 100°F (38°C) day; the losses are measured and displayed to the DOC analyst. The measured losses are a function of the system configuration, connected loads and connected circuit impedance. The heat wave is expected to continue for the next several days. During the overnight hours after the first 100°F day, the DOC analyst implements the loss minimization tool for the DOC’s area of responsibility.
The loss minimization tool considers alternate feeder configurations while running unbalanced load flow calculations based on the actual load measurements from the previous day. The loss minimization iterations converge on the configuration having the least losses and display the switching order to reconfigure the distribution system in anticipation of the next 100°F day. The switching is performed during overnight hours. As the load builds on the next 100°F day to the daily system peak, new peak conditions are captured to repeat the process again overnight. The optimum least-loss configuration may have changed because of changing loads.
The same loss minimization analysis also can be performed during extreme cold-weather conditions. The optimum configuration for the distribution system will probably change because of different load conditions. However, the DOC analyst performs the same analysis, but the switching may be performed during the daylight hours when the system loads may moderate as the ambient temperature rises.
As the deployment of automated switchable devices increases, the opportunities increase to maintain the optimum configuration remotely (that is, the least-loss configuration) in near real time. The DOC operator becomes an efficient energy delivery manager while optimizing the configuration of the distribution system.
Distribution Analysis Techniques
The application of distribution analysis techniques to manage the efficiency of electric distribution has been well documented in the industry. However, these same advanced operation techniques can be applied during outage and service restoration events. When developing a restoration plan after a system fault has occurred, the operator typically plans to shift the unfaulted portion of the distribution feeder to an alternate feeder. IDMS supports unbalanced load flow calculations that are run periodically or triggered by system events such as switch-state changes.
The operator and DOC analyst have a study mode in IDMS where the proposed switching plan can be validated based on current system configuration and loads. In the study mode, load and voltage violations, if any, are identified and displayed to the operating personnel. The volt/VAR optimization CVR plan (that is, a distribution optimal power flow objective of IDMS) is performed for the reconfigured distribution circuit to mitigate, if possible, any load and voltage violations in the abnormal feeder configuration.
The system manipulates circuit voltage profiles with regulator tap changes and capacitor changes to minimize demand. Thus, the unfaulted portion of the distribution feeder can be transferred to an alternate feeder without either voltage or load violations. IDMS then presents a switching order to perform the switching activity and complete the transfer. A future IDMS objective is to permit the system to execute the switching automatically without further operator intervention.
After feeder repairs are completed and the fault is removed from the system, the operator implements a return-to-normal advisory switching plan, another distribution optimal power flow objective of IDMS. When the return-to-normal switching plan is implemented, it restores normally open devices after the system disruption. The restoration plan, or return-to-normal feeder configuration, minimizes customer disturbance. Frequently, customers in the unfaulted portion of the distribution feeder are not interrupted when the switching is performed to return the system to its normal configuration. The return-to-normal switching plan is also validated in the study mode before real-world switching is performed.
IDMS is built on Alstom’s e-terradistribution software suite of tools for the operating environment in the distribution control center. IDMS provides for the integration of DSCADA, switching management and geographic switching diagram in the DMS delivery. Outage management functionality is also included in the integrated software delivery.
As the distribution energy ecosystem evolves into a virtual power plant, the DOC analyst will coordinate demand-response events and distribution energy producers. The DOC analyst will become the energy-efficiency expert in the DOC.
Smart Operations
The emerging smart distribution grid requires improved techniques and applications. The DOC analyst provides engineering solutions to achieve improved system efficiency. The engineering solutions are applicable during both peak and valley conditions. The engineering solutions can be applied effectively to service-restoration events. The DOC analyst coordinates demand-response events and distribution energy producers, becoming the energy-efficiency expert in the DOC.
George Larry Clark ([email protected]) is a principal engineer in power delivery for Alabama Power Co. and supports the deployment of the distribution SCADA, distribution automation and electronic mapboard technologies. He also supports the development of the integrated distribution management system and smart grid strategy for Alabama Power and Southern Co. During his 47 years at Alabama Power, Clark’s responsibilities have included the operation and maintenance of T&D substations, and the planning, operation and maintenance of the electric distribution system. Clark received a BSEE degree from the University of South Alabama. A life senior member of IEEE, Clark is the chairman of the IEEE PES Smart Distribution Working Group. He is a registered engineer in Alabama.
Companies mentioned:
Alabama Power | www.alabamapower.com
Alstom | www.alstom.com

