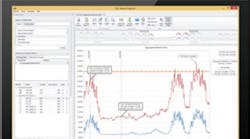
Schweitzer Engineering Laboratories, Inc. has announced a new release of its acSELerator Meter Reports SEL-5630 Software.
This latest version includes support for dynamic viewing tools, faster database interrogation and offline demonstrations.
acSELerator Meter Reports Software helps users organize, visualize and optimize energy usage, using data from SEL-734 Advanced Metering Systems, SEL-735 Power Quality and Revenue Meters and SEL751A Feeder Protection Relays.
acSELerator Meter Reports Software trends energy consumption data, so operators can avoid peak demand charges and optimize a schedule that moves overlapping electric processes to off-peak hours.
Additionally, the software offers tools to diagnose voltage disturbances using historical data, so the user can assess the impact and improve system operation.
The latest release of acSELerator Meter Reports is accompanied by an integrated demonstration database. This feature gives anyone with a mySEL account the opportunity to download and evaluate the new features at no charge. The built-in sample database replicates a real-world metering system, so it can operate without an active acSELerator Team® SEL-5045 Software connection.
The demo database includes seven standard report types and a report designer to create customized views:
- Device Overview
- Sequential Events Recorder
- Load Data Profile
- Energy Balance
- Water, Air, Gas, Electricity, and Steam (WAGES)
- Voltage Sage, Swell, and Interruption (VSSI) Summary
- VSSI Detail
With acSELerator Meter Reports, anyone can visualize data, filter events, add labels to data points and find the max, min or difference in a user-friendly interface. This is especially valuable to facility owners, who increasingly rely on resource usage to drive planning, operating and accounting decisions.


