U.S. Utilities Report $161.8 Billion in T&D Additions Between 2013 and 2016
The growth in overall spending on new T&D infrastructure, and operation and maintenance is being driven by several factors including: the replacement of aging infrastructure, new transmission enabling growth in renewable energy, and technology upgrades for the distribution grid.
This is the second article in a series highlighting analysis of this year’s FERC Form 1 filings – only operating utilities reporting one of the following are required to report; over a million MWh of total annual sales, over 100 MWh of power sales for resale, or companies with over 500 MWh of exchanges delivered or wheeled for other companies. The analysis includes data from all 193 U.S. operating companies required to report financial and operating statistics between 2013 and 2016. Electric plant in-service additions include the original cost of new infrastructure added during the year which makes it a great indicator of a company’s investment in the grid.
Transmission in service additions include breakouts of land and land rights, structures and improvements, station equipment, towers, poles, fixtures, overhead conductors, and underground conduits and other equipment.
Distribution in service additions include many of the same categories as transmission, as well as, storage battery equipment, line transformers, meters, street lighting and signal systems, and leased property on customer premises.
This analysis is a continuation of a project conducted for power industry intelligence provider Energy Acuity.
Overall T&D Spending Trending Up Year on Year
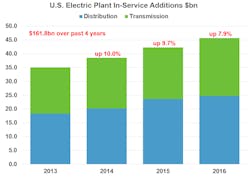
Electric companies reported $161.8 billion in new T&D infrastructure additions from 2013 through 2016. Growth over the four-year period has averaged 9.2% moving from $35bn in 2013 to over $45 billion in 2016. Transmission additions grew by 14.6% in 2016 alone reaching $21 billion for the first time. Distribution additions grew by 6.4% last year reaching $24.7 billion.
Top Electric Operating Companies In T&D Additions
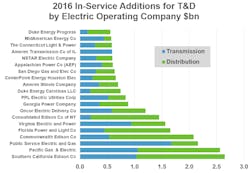
Southern California Edison topped the list of electric operating companies reporting T&D in-service additions in 2016 at $2.7bn with distribution accounting for 60.9% of the total. Following closely was Pacific Gas and Electric at $2.6 billion with distribution accounting for 58.8%. Public Service Electric and Gas reported $2.2bn with transmission accounting for 77.5% of total T&D. Rounding out the top five in new infrastructure additions were Commonwealth Edison at $2.1bn and Florida Power and Light at $1.7 billion. The top 20 electric operating companies adding new T&D infrastructure in 2016 are listed below.
Double Digit Growth on Transmission O&M
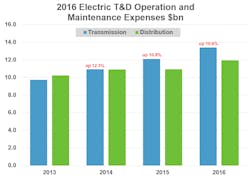
Spend on transmission O&M has grown at a double-digit pace from $9.7 billion in 2013 to $13.4bn in 2016. During the same four-year period, distribution O&M grew from $10.2 billion in 2013 to $11.9 billion in 2016.
Transmission O&M includes operation costs like load dispatch, scheduling, reliability planning, transmission service and interconnection studies, station expenses, overhead and underground line expenses and wheeling by others. The maintenance categories include structures, supervision and engineering, computer hardware and software, station equipment and overhead and underground line maintenance. Distribution O&M includes similar operation expense categories as well as meter expenses, street lighting and customer installations. Distribution maintenance expense include other categories as well including, maintenance of line transformers, street lighting and meters.
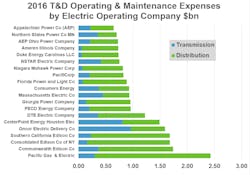
Top Operating Companies in Transmission and Distribution O&M Expenses
Pacific Gas & Electric topped the list of electric operating companies O&M spend on T&D in 2016 at $2.43 billion – 88% on distribution. Commonwealth Edison was second with $1.74 billion – 79% on distribution O&M. Consolidated Edison Co of NY spent $1.68 billion – 90% on distribution. Southern California Edison also spent approximately $1.68 billion with 86% on distribution. The only two companies in the top 6 reporting higher O&M expenses for transmission than distribution in 2016 were Oncor Electric Delivery Company at $1.59 billion (60.5% for transmission) and CenterPoint Energy Houston Electric at $1.49 billion (54.4% for transmission). The top 20 electric operating companies in T&D operation and maintenance spending in 2016 are listed below.
What is unusual is to see all this growth during a period where power demand and customer rates have remained relatively flat. Low fuel prices, predominately for natural gas and relatively low interest rates have made it possible to increase spend on T&D and on power production while not alarming customers with hefty increases in electric rates. It’s been a great time to build new infrastructure and to enhance the grid. Will it last? We think so.
Expect more investment in T&D in 2017 and 2018 given the large number of transmission projects currently under construction and the continued build out of smart grid technology for the distribution network.
