Synchrophasor data generated by phasor measurement units allow time-synchronized observations of disturbances and power oscillations on electric power grids. Events contain valuable information on the dynamics of the electric power grid that can determine dynamic parameters describing the grid.
New event detection methods used with data can automatically detect events on the grid. Once a disturbance has been detected, it shows how the event is quantified by estimating the oscillation frequencies and damping parameters using a system identification algorithm. The real-time event detection and dynamic characterization of disturbances are used as the main situational awareness tools at the University of California, San Diego (UCSD).
Monitoring the Grid
The electric power industry is beginning to observe power grid dynamic behavior not seen previously. This is partially because of the recent installation of more than 1,000 phasor measurement units (PMUs) funded, in part, by the U.S. Department of Energy’s Smart Grid Investment Grant program. The observed disturbances generally are caused by generation loss, topology, load changes and increased penetration of renewable power sources. Additionally, measurements on distribution networks indicate harmonic and non-sinusoidal power flow, and — especially in microgrids — they are showing overall power quality may not meet standards.
In addition to external perturbations from the area electric power system, the UCSD campus (local electric power system) experiences internal microgrid disturbances as a result of the high percentage of solar power generation located in the coastal fog zone and electric-vehicle charging systems, as well from the nonlinear loads from laboratory experiments and hospitals on campus. Additional disturbances caused by the campus’ combined heating and power plant, local heating and additional electric chiller loads, fuel cell and large battery loads from multiple experimental battery systems continually perturb the power quality of the microgrid.
At times, tens to hundreds of significant local disturbances occur each day on the UCSD campus, and external disturbances within the Western Electricity Coordinating Council (WECC) can be observed on the UCSD campus regularly.
Disturbance Event Information
Each disturbance event on a microgrid, either local or external, excites the dynamics of the power network. In the case of the UCSD microgrid, a disturbance event provides valuable information on the dynamic parameters of the microgrid and can be used to study the stability of either the WECC grid or the UCSD microgrid, depending on whether the event is local or throughout WECC. However, to study and monitor the stability of the grid, the disturbance event must be detected first. As PMUs distributed throughout a microgrid may produce multiple (noisy) data streams in excess of 30-Hz sampling, automatic and real-time detection of disturbance events is a prerequisite for the extraction of (dynamic) information from grid disturbance events.
Signal processing techniques currently used for event detection on the basis of PMU data are based on a moving discrete Fourier transform (DFT) or specially designed (linear) band pass filters that extract features from the PMU data in user-specified frequency bands. Although these techniques are successful in many applications that use PMU data to monitor electric power quality, they require the specification of accompanying threshold levels in the user-specified frequency bands for event detection.
The threshold values for event detection depend highly on the quality and noise properties of the data produced by the PMU, requiring tuning for each PMU distributed on the electric grid. Furthermore, filtering or a DFT of the PMU signal does not extract the valuable information on the dynamic parameters of the microgrid.
Signal processing with recursive estimation can be used to facilitate real-time detection of disturbance events (in user-specified frequency bands) by automatically adjusting the threshold levels for each PMU distributed throughout the electric grid. Once a disturbance has been detected, the event is quantified by its dynamic parameters by estimating the oscillation frequencies and damping parameters using a realization algorithm. Computations for adjustment of threshold levels and the real-time detection of disturbance events are implemented on each PMU independently, providing a distributed solution for a network with a limited bandwidth for PMU data streaming.
Overview of PMUs at UCSD
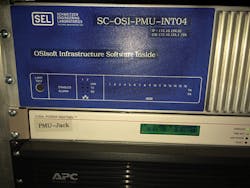
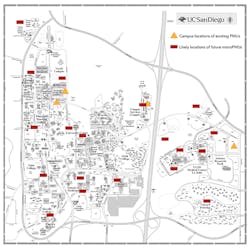
For the past three years, five or more relay-based PMUs and dedicated PMU devices have been operational on the microgrid of UCSD. Typically, 40 or more measurements from each PMU are archived at the rate of 30 Hz in the OSISoft PI server system located at UCSD.
The PMUs are located as follows:
- The Scripps Institute of Oceanography, in a building with critical cooling and refrigeration load
- The San Diego Super Computer, a critical load of more than 3 MW
- The main 69/12-kV feeder substation
- The far-eastern edge of the UCSD campus.
These locations provide source measurements required to compute the angle difference across the entire breadth of the campus.
UCSD is currently installing 20 additional microPMUs on critical loads and sources across the campus. The development of these new devices was made possible by a grant from the ARPA-E division of the Department of Energy. The new units are being installed on buildings with loads in excess of 1 MW as well as large battery systems, fuel cells, hospitals and electric-vehicle charging systems. With these measurements, it is anticipated the distributed energy resources on the UCSD campus can be controlled individually to minimize power losses while the UCSD microgrid operates in island mode.
Event Detection
PMUs produce multiple (noisy) data streams at rates of 30 Hz or more. An automatic method of detecting disturbance events without using a threshold crossing was implemented. A constant threshold crossing method creates far too many false alarms, so an adaptive one-step-ahead filter was developed that automatically marks the beginning of an event and determines the dynamic parameters that describe the disturbance event; it includes three distinguishable components:
- One-step-ahead prediction error minimization
- A filtered rate of change (FRoC)
- An adaptive threshold crossing explained in the panel.
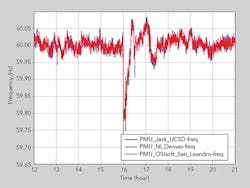
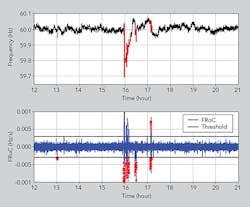
To illustrate event detection based on the one-step-ahead prediction error minimization, followed by an adaptive threshold crossing of a FRoC signal, frequency measurements from PMUs located at UCSD were used on a WECC event that occurred on May 30, 2013. Although the major power disturbance event occurred around 4 p.m., small initial and subsequent events also were present in the data. The proposed event detection algorithm detected all of these events automatically.
Based on initial measurements of the PMU frequency signal, before any power disturbances are present, the parameters of the prediction error filter are calibrated and the resulting variance of the FRoC signal is estimated. Real-time event detection is performed with test points to avoid detection of single-data-point anomalies in the data. The results indicate the proposed event detection algorithm marks several events. In addition, the event detection marks the frequency measurements right after the detected event for further processing to quantify the event fully.
Event Analysis
Disturbance events contain valuable information on the dynamics of the electric power grid in terms of oscillation frequencies and their damping coefficients. Once the event has been detected and data has been marked, ring-down analysis can be done by various methods. In this approach, a step-based realization algorithm (SBRA) — based on the step-response algorithm — is used to quantify an event by its dynamic parameters.
Application of SBRA Method
The use of the SBRA requires the time-synchronized frequency measurements from the three different PMUs to quantify the detected event. When zooming in on the detected event, the difference in dynamics among the data from the different PMUs is observed. The SBRA algorithm requires 10 states — five resonance modes — to capture the oscillation frequencies and their damping coefficients accurately. With the estimated discrete-time state-space model, the event also can be resimulated and provide a direct comparison with the measured time-synchronized frequency measurements from the different PMUs. The results provide an excellent fit of the measured data with a single multi-output ring-down analysis model.
Automatic Event Notification
At times, there can be hundreds of events per day or zero events. Most of the time, the operators are out in the field without access to the system display screens. The microgrid operators receive automatic notification of events via short message service (SMS) and email messages that include the time and location of the event, as well as a link to a graphic screen showing a trend plot of the event and the dynamic parameters describing the event. The severity of the event is reported based on a classification method that computes the probability the event is significant. This informs the grid operator of issues on the microgrid. As the event database grows, it is expected specific actions will be able to be suggested to the operator to increase grid security. This might be in the form of a suggestion to reconfigure the breaker protection settings or to change the grid topology.
Advanced Control
Current research includes demonstrating a closed-loop controller that dampens the oscillations using real and reactive power commands from a photovoltaic grid-tied inverter. The control commands specifically modulate the real and reactive power output of the inverter to mitigate the oscillations. An advanced microgrid controller regulates voltage and frequency simultaneously using a decoupled control algorithm.
Acknowledgement
The author would like to thank Dr. Charles H. Wells and OSIsoft, LLC for providing the real-time data infrastructure for the UCSD PMU research. Wells initially pointed out the potential use of advanced system event detection and system parameter identification technology in transmission and distribution systems.
Raymond A. de Callafon ([email protected]) is a full professor in the Department of Mechanical and Aerospace Engineering at the University of California, San Diego. He has been at UCSD since 1998. As director of the System Identification and Control Laboratory at UCSD, he has directed research projects on active noise, vibration isolation and identification of grid dynamics.

