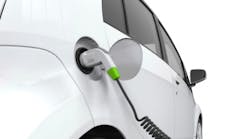
Electric cars – encompassing the full battery of products ranging from traditional hybrids, plug-in hybrids and pure electric vehicles – have seen some impressive benchmarks come and go in recent years. 2013 and 2014 each saw sales for this segment exceeding the half-million mark, and 2015 is on track for a repeat. As of the end of July, nearly 290,000 vehicles with a battery generating at least some of their momentum have been sold in the U.S., including nearly 120,000 plug-in models (whether pure electrics or plug-in hybrids).
But while that is indisputably a lot of vehicles, 2015 sales numbers to date still represent the same 3% of total U.S. vehicle sales seen in 2012, before some major players joined the charge. But what might lie ahead for the segment?
Just under half of American car owners (or anticipated owners) say they'd consider a traditional hybrid the next time they're in the market for a new vehicle (48%, identical to 2013 findings); lower consideration levels were recorded for plug-in vehicles, whether they be hybrids (29%, up 2 percentage points) or pure electrics (21%, also up 2 points). An additional two in ten would consider a diesel (19%, up 3 points), while 35% would consider a smaller or gas powered vehicle to save on operating costs (down 3 points).
These are among the findings from a Harris Poll of 2,225 U.S. adults (aged 18 and older) surveyed online from May 20-26, 2015. Full results of this study, including data tables, can be found here.
Most of these vehicles appeal more to some groups than to others:
- Millennial drivers are more likely than their elder counterparts to consider a traditional hybrid, with 57% saying they'd consider one (vs. 49% of Gen Xers, 43% of Baby Boomers and 38% of Matures). This same trend holds true for plug-in hybrids (39% vs. 28%, 22% and 23%) and pure electrics (34% vs. 17%, 14% and 11%), as well as for diesel vehicles (27% vs. 16%, 17% and 9%).
- Men are more likely than women to consider an electric vehicle (25% men, 17% women) and more than twice as likely to indicate that they'd consider a diesel (28% men, 11% women).
- Distance drivers – those who travel over 50 miles in an average day – are especially likely to say they'd consider a plug-in hybrid (38%, vs. 28% of those traveling 30 miles or less in a typical day), a pure electric (32% vs. 18%) or a diesel (28% vs. 17%).
- Democrats and Independents are more likely than Republicans to consider a traditional hybrid (53% Dem, 52% Ind and 42% Rep), a plug-in hybrid (34%, 32% and 20%) or a pure electric (26%, 25% and 10%).
Barriers for electric vehicle consideration
When asked to select their top concerns related to pure electric vehicles, price (67%) and range (64%) rise to the top, followed by repair/maintenance costs (58%), reliability (53%), performance/power (50%) and the fact that it's still new technology (42%).
- Price (73% Matures, 71% Baby Boomers, 63% each Gen Xers and Millennials) and range (75%, 75%, 58% and 52%) are especially strong concerns among older Americans.
What does this mean? Well, for one thing it means that American drivers' top concern when considering a new vehicle – reliability, which 93% rate "very important" – is not among the top barriers standing in the way of electric car adoption.
But money talks: in addition to being the top barrier to electric car adoption, purchase cost is the second most important consideration when looking at a new vehicle (with 81% considering it very important). Right now hybrids and electrics still come at a premium when shopped against otherwise comparable vehicles, but those comparative costs are slowly going down. Time will tell whether this might lead to stronger sales.
Methodology
This Harris Poll was conducted online, in English, within the United States between May 20 and 26, 2015 among 2,225 adults (aged 18 and over). Figures for age, sex, race/ethnicity, education, region and household income were weighted where necessary to bring them into line with their actual proportions in the population. Propensity score weighting was also used to adjust for respondents' propensity to be online.
All sample surveys and polls, whether or not they use probability sampling, are subject to multiple sources of error which are most often not possible to quantify or estimate, including sampling error, coverage error, error associated with nonresponse, error associated with question wording and response options, and post-survey weighting and adjustments. Therefore, The Harris Poll avoids the words "margin of error" as they are misleading. All that can be calculated are different possible sampling errors with different probabilities for pure, unweighted, random samples with 100% response rates. These are only theoretical because no published polls come close to this ideal.
Respondents for this survey were selected from among those who have agreed to participate in Harris Poll surveys. The data have been weighted to reflect the composition of the adult population. Because the sample is based on those who agreed to participate in our panel, no estimates of theoretical sampling error can be calculated.


