Let's look at key formulas that are the building blocks for the transfer of electricity: real and reactive power transfer formulas and their basics.
The power triangle represents an essential building block to the understanding of power systems. Without indulging much in theories and formulas, it is crucial to understand how phase angles, voltage differences, and impedance help transfer real (MW) and reactive (MVAR) power.
What is a power triangle?
What does the power triangle look like?
How do you transmit power?
- To transmit MW from point A to B, the phase angle at point A must be leading. The amount of MW being transferred is a function of the phase angle difference.
- To transmit MVAR from point A to B, the voltage at point A must be higher than point B. The phase angle difference plays less of a significant role here. Therefore, it is important to have transformers and stations (i.e. 4 kV stations connected in a grid) under a tight voltage schedule in order to minimize circulating current/VARs.
How is the power supplied?
- The generator supplies both real and reactive power down to the customer’s location.
- The ideal design is to have the transformers/supply feeders supply as much MW as they are rated for.
- Other sources such as capacitor banks and line charging should then supply the MVAR necessary to result in the transformer power factor being close to unity (see Figure 1).
What does this power transfer look like?
Can you give an example of how this works?
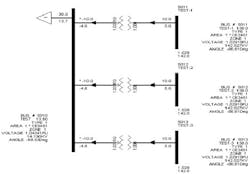
To illustrate the above concepts, I have created station “Test” with three 138/13.8 kV step-down transformers that have identical impedances.
Here’s how it works:
- The station load is 30 MW and the load power factor is 0.91 (by using the second equation in figure 1, the MVAR will be = 13.7 MVAR).
- The 138 kV and 13.6 kV are the base voltages for the system being studied. As seen in the figure above, the transmission voltage for this flow is around 142 kV, and the distribution voltage is 14.2 kV, which is acceptable in this scenario.
- Transmission buses 5011, 5012 and 5013 each supply 10 MW and 5 MVAR to the substation (all transformers have the same impedance and all transmission feeders have the same source and impedance in this example).
- The delta between the 15 MVAR supplied to the high side of the transformers and the station reactive power load of 13.7 MVAR are losses through the step down transformers. As expected, the phase angles for buses 5011, 5012 and 5013 are leading the substation phase angle and that enables the MW power flow.
What is the power transfer formula?
The real power transfer formula is shown in per unit and in MW, where E1 is voltage at point 1 (bus 5011) and E2 is voltage at point 2 (bus 5010). Z is the impedance between the two points (in this case, the transformer’s impedance), Z = R +jX, where R is the resistance and X is the reactance. Ø is the phase angle difference between the two points.
Upon solving the formula, the MW flow from bus 5011 to bus 5010 is 10 MW. This is the same as the MW in the load flow shown in figure 2.
What about the reactive power transfer formula?
In this formula, we assumed that X >>R, and thus R = 0; the formula shows a MVAR value of -4.1 MVAR, which means that the reactive power is flowing from E2 to E1; and these results don’t agree with the +5 MVAR shown in figure 2.
MVAR is a function of the voltage. To send power from E1 to E2, the voltage at E1 must be higher than E2; however, as seen from the per unit values in figure 2, E2 is less than E1, even though E1 and E2 are on a different voltage base.
The reason for the discrepancy is that the formulas found in most reference books are usually used to calculate the reactive power flow between two buses; however, in this case we have a step-down transformer and the per-unit ratio (LTC position) makes a difference in the calculation. As seen from figure 2, the LTC position is 1.031.
What is an updated reactive power transfer formula?
The reactive power transfer formula is correctly shown in figure 5, and the results concur with figure 2.
Figure 6 shows the revised Power transfer formula shown in figure 2 by considering the LTC position.
How would this formula change if you took a transformer out of service?
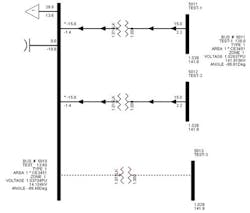
Figure 7 shows the flows after a 10 MVAR capacitor bank was added and the third transformer was taken out of service.
What are six other things you should keep in mind when doing the calculations?
- The 10 MVAR capacitor bank is showing 10.8 MVAR. The reason for the increased VARs is that capacitance is a function of the voltage squared. In the model, the base voltage was 13.6 kV and in the flow on figure 7, the station voltage was 14.104 kV, thus Capacitor MVAR = (14.104/13.6)^2 x 10 MVAR = 10.8 MVAR.
- The remaining transformers supply less MVARs due to the capacitor contribution.
- Due to transformer 3 being out of service, the remaining transformers will supply the entire station load. The circuit now shows more impedance because there are two parallel lines compared to the three lines.
- The phase angle difference between bus 5011 and bus 5010 has increased from 1.92 (3 circuits in parallel) to 2.87Ë.
- The LTC position is showing 1.031LK (LK shows lock). This is the condition as soon as a contingency occurs, before the remaining transformers’ LTC start to move. This condition in PSS/E is called Prior Transient Load Flow (PTLF).
- Using the formulas in figures 5 and 6: the flow on each in-service circuit is 15.03 MW & 2.3 MVAR, or 15.03 + j2.3, which is very close to the flow on figure 7.
About the Author
Ahmed Mousa
Principal Engineer/Adjunct Professor/Board Member/Founder & CEO
Ahmed Mousa, M.S.E.E., has over 12 years of experience in transmission, sub-transmission, substations and distribution systems with industry leaders such as Consolidated Edison, PSE&G, PEPCO, and First Energy. He is a subject matter expert in transmission/sub-transmission, distribution and substation planning. Ahmed has years of expertise conducting PSS/E load flows, i.e. forced & scheduled outages analysis, phase angle studies, voltage analysis, network/non-network load transfers. Ahmed provides analysis and support during heat waves, storms and other system emergencies.
Mr. Mousa is an Adjunct Professor at New Jersey Institute of Technology (NJIT) teaching advanced topics graduate electrical engineering courses.
Mr. Mousa serves on the New Jersey Association of Energy Engineers board as a board member.
Mr. Mousa is currently the Principal Engineer at PSE&G in the Electric Delivery Planning section, where he is responsible for managing power system generation, transmission and distribution simulation studies, developing the short/ long range substation forecasts, analysis and load relief, performing short circuit studies, performing breaker duty analysis, developing transmission and distribution station and feeder designs, reviewing large customer demand proposals. Mr. Mousa is responsible for all Distributed Energy Resources technical evaluations and interconnection agreements.
Mr. Mousa is the Founder/CEO of The Electric Bridge Consulting firm assisting large and small utilities, colleges/universities & consulting firms by providing electric utility services, educational/training services, consulting services, leadership seminars, career consulting, lecturing services, electric professional engineering courses & national & international webinars.
Mr. Mousa was responsible for the short term, long term (1/5/10/20/30 years), and emergency planning for the area substation, transmission / sub-transmission feeders and the 4 kV system at Consolidated Edison. He has conducted several studies on the impact of electric vehicles, distributed generation, steam to AC conversion, energy efficiency models, and R&D initiatives on the distribution and transmission system.
Mr. Mousa was the project manager for a SCADA GE XA21 Energy Management System and the project manager and project engineer for President Obama’s Department of Energy stimulus grant for Consolidated Edison’s 4 kV system.
Awards include the 2009 3rd Quarter Distribution Engineering ALVA Award for 21st Century Leader, the 2012 “Sustain Energy Reliability” Team Award, and the 2013 Excellence in Design and Genius Engineer (EDGE) Award Nominee for “Developed Load Calculation Tools for System and Transmission Operations.” He has over eight years of experience in providing training in a wide range of subjects including PSS/E, 4 kV systems, distributed generation grid adoption, system operation outage analysis, transformer ratings, voltage studies, basic and advanced power flow, intermeshes, phase angle studies, capacitor bank impact on the grid, smart grid, plant information (PI), post contingency analysis, voltage reduction, and conservation voltage optimization. Mr. Mousa received his Bachelor's Degree in Electrical Engineering from Stony Brook University and later a Master's Degree in Electrical Engineering from Manhattan College and has completed the Siemens PTI Distribution and Transmission courses.


