Smart Analytics Drive Smart Asset Management
Imagine if meter data could be analyzed to help drive asset management and operational innovation. While many have been discussing such an opportunity, PECO, an Exelon company, has been working with smart systems now for decades. PECO first began exploring ways to use the daily meter readings beyond customer billing to derive additional benefit from its one-way automatic meter reading (AMR) platform. While promising, these initial efforts were limited because of the granularity and resolution of the data. Hourly interval data was needed.
In response to local state legislation, combined with funding from an American Recovery and Reinvestment Act stimulus grant, PECO is actively replacing its AMR system with a contemporary advanced meter infrastructure (AMI) platform. This project is one of PECO’s largest investments and will, when deployment is complete, cover all of its 1.6 million electric and gas customers. All meters are being configured to record energy usage at a minimum of hourly intervals, which creates an opportunity to increase the use of data and analytics dramatically across the enterprise.
As data begins to flow from the meters, it becomes important to develop the means to use this data effectively. One of the more interesting uses of this data is asset management, where individual customer usage is aggregated to a single value to represent the loads and usage on a particular transformer. These values are further extrapolated into full-circuit models that can be used to evaluate equipment loading and increase situational awareness to improve the meter-to-transformer connectivity model continuously.
Balanced Asset Management
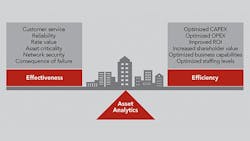
Asset management has always been a balancing act between effectiveness (the availability and efficiency of the equipment) and efficiency (the cost of providing the equipment). Being able to effectively allocate resources to provide higher levels of customer service and reliability while balancing financial objectives can be difficult, and asset risk management often comes down to the utility’s ability to optimize the availability of the assets against the cost constraints of providing that availability.
For PECO, being able to aggregate meter data to the source transformer means the utility is able to gain a much better understanding of asset health to help balance the conflicting objectives of effectiveness with efficiency. The utility’s objective was to better understand which transformers may be at risk of being overloaded during peak periods. With such knowledge, work could be prioritized and potential failures prevented, thereby ensuring every dollar invested in asset management is in the highest-priority category.
Connectivity Model Accuracy
As the utility industry transforms itself with smart grids, the need to have accurate connectivity and asset models for predictive asset assessment is becoming increasingly important. Inaccuracies in the mapping of which transformer serves each customer need to be identified and corrected. Traditional methods for making such corrections, which require field surveying and verification of the connectivity, are slow and labor intensive. These processes can be improved and automated with analytics and AMI data.
Specific solutions to improve the connectivity model employ outage alarms and voltage data from the meter. Individual outage event messages can be cross-referenced against known outages to understand if all expected meters actually have experienced and reported the outage. Any missing or extra reports are indications of errors in the model, which can be prioritized for further analysis and correction. Once this type of process is documented and validated, it can be automated as one of the first steps in creating a truly advanced smart grid.
It also should be noted that a similar process can be used to improve the transformer phase assignments and line segment documentation.
Asset Management Solutions
Once it is understood and this connectivity model is at an acceptable level of accuracy, then asset management solutions can be considered. A good starting point is to identify overloaded or stressed assets that may create undo risk. Such analysis can lead to many other types of programs such as proactive transformer management or even applying the same concepts to cables and other circuit elements.
Since the hourly interval data from each meter represents the electric demand, interval data can be used to build utilization models of the entire distribution grid. The first step for PECO was to sum the loads of the individual customers on specific transformers to get an overall usage or load shape for the transformer. This enables the utility to see which customers are most responsible for the overall load shape of the transformer.
Identifying At-Risk Transformers
Once the transformer load shape framework is developed, applications can be run to monitor each distribution transformer’s performance over any defined period. PECO worked with Oracle’s DataRaker team to develop a framework and apply it to the utility’s entire population of distribution transformers. The first application was for a suspected at-risk population of transformers. The result showed the risk was minimal and could be eliminated through local reconfiguration of loads. This type of analysis is used regularly now as part of PECO’s summer and winter readiness activities.
The next logical step will be to develop overall normal operating parameters for each device. These parameters will be used to define normal operating envelopes. Then, if the device load suddenly exceeds the envelope, exceptions will be generated and subsequently reported for further investigation. The advantage to using this type of analysis at the transformer level is not only in recognizing changes can occur quickly without other notification, but also to ensure the electrical distribution system is optimally sized and operating at peak efficiency.
Post-Failure Analysis
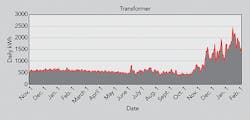
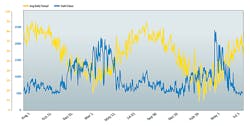
PECO has expanded this analysis methodology to create a post-failure analysis tool. When PECO’s outage management system identifies a transformer failure, the dispatcher can run an analysis to see if the failure coincided with a peak load. The tool graphically shows the transformer load up to the point of failure, which helps the dispatcher to recommend the proper course of action to restore load and prevent future failure. The graph below offers an example of a transformer with a relatively sudden increase of load shape that otherwise had been performing constantly over a long period. The change in load was attributed to an apartment building that switched to electric heat without notifying PECO.
Having a system with the ability to recognize this type of issue is paramount if the goal is to avoid failures proactively at critical times. In this case, PECO was able to upsize the transformer to ensure power remained available for that customer.
New Opportunities in Predicting Failures
Once transformer load profiles were created, PECO moved to better understand how to use hourly consumption data and mechanical thresholds to improve predictive failure analytics. As it turned out, last winter, which was one of the coldest in recent history, provided PECO with excellent data from which to build predictive analytics.
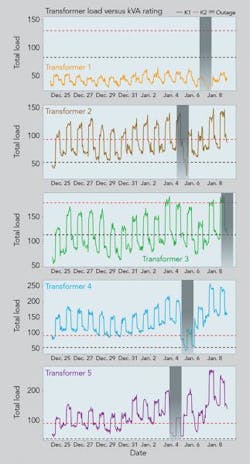
For this case study, PECO built a use case and provided the Oracle DataRaker team with transformer failure data from early January 2015 and asked, “Could we have predicted transformer failures related to overload with our current data?” As a starting point, PECO selected five transformers determined to have failed due to overloading.
This analysis was retroactive and, in some cases, the transformers selected were in areas not fully converted to AMI at the time, so there was a mix of AMI and AMR data. (This is important because the AMR data is from daily not hourly reads.) In these cases, the load was disaggregated by associating one-sixteenth of the daily hours (or peak load hours) with the remainder of the load spread evenly across the remaining hours to create a realistic approximation of the actual transformer load shape. The actual loads were then compared to both the normal and emergency rating of the transformer.
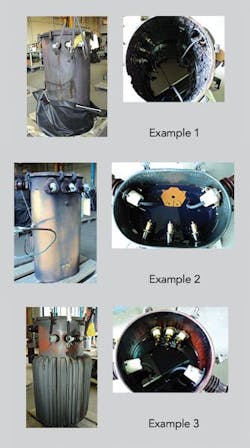
Analysis showed some failures originally attributed to overload had no evidence of any overload, while other failures had signs the transformer was regularly operating near emergency ratings. Further analysis determined a predictive analysis routine could be identify the loading trends and predict a future failure. Subsequently, this routine indicated four of the five failed transformers showed previously unidentified signs of overloading, which may have contributed to the failure.
Based on this analysis, PECO concluded additional investigation is warranted. The utility will be continuing this effort throughout the summer month, working to determine differences in the loading patterns and how to react to them.
Quantifying the Benefit
As is true with any investment, it is essential to be able to quantify return or benefit. As previously discussed, one of PECO’s first uses of transformer analytics was to analyze the data from a certain class of transformers in which the utility was seeing unexpected failures. Using the Oracle DataRaker solution, PECO determined what the actual loads on one transformer were and then applied the analysis to the other transformers in the same class to identify at-risk transformers and prevent future failures.
The results achieved by this analytics-fueled approach to proactive asset management encouraged PECO to look at other aspects of transformer asset management, including summer and winter readiness: identifying what transformers are at risk, understanding the prediction of being at risk, and using the results of load and transformer analysis to justify additional work, whether it is load relief or other reliability-based projects. This work also produced clear benefits and operational savings.
Next Steps
While finding overloaded transformers is an excellent first step, it may not be, in itself, a positive predictor of failure. However, by further defining more detailed, loss-of-life analytics, such as the number of hours the transformer exceeds its normal load ratings, a more reliable predictor of transformer failure can be developed.
Other analytics can be defined, as well. For instance, the initial thresholds that have been established for normal and emergency ratings can be refined through the continuous data flow. Taking a more comprehensive look at how much a specific transformer’s load changes over time and how it reacts to seasonal and environmental conditions will yield improved failure predictors.
With this in mind, PECO’s end goal is to be able to best utilize all available data to create a solution that continuously monitors all transformers to best manage the distribution system.
PECO also is considering expanding this sort of analysis beyond its distribution transformer population to underground cables and services. These processes also can be used to perform a top-down or bottom-up analysis of every circuit, comparing the energy leaving the substation to the energy consumed to understand and document how the distribution grid is working, and identify actual line losses and even energy theft.
Glenn Pritchard ([email protected]) is PECO’s principal engineer for smart grid and AMI solutions. He has been responsible for smart grid deployment which includes the installation of a hybrid communications network consisting of fiber optic and radio communications, the system-wide replacement of 1.8 million electric and 500,000 gas meters and the installation of hundreds of distribution automation devices. He holds a BSEE degree from Clemson University and is a registered professional engineer in Pennsylvania.
Transformer Loading Shape vs. Time
A two-year case study tracked the load shape (blue line) of an actual transformer along with the outside temperature (yellow line). Over the first year, the loads remained relatively flat and unresponsive to temperature. There were minor fluctuations but no conclusive correlations to temperature change.
In the second year, however, load increases are directly related to temperature variations. This indicates the predominant customers on this transformer may have changed their heating sources. An on-site investigation determined the customer had converted their heating source to electric resistive heat.
Similar analysis can indicate when customers add electric vehicles or modernize their equipment or appliances.
